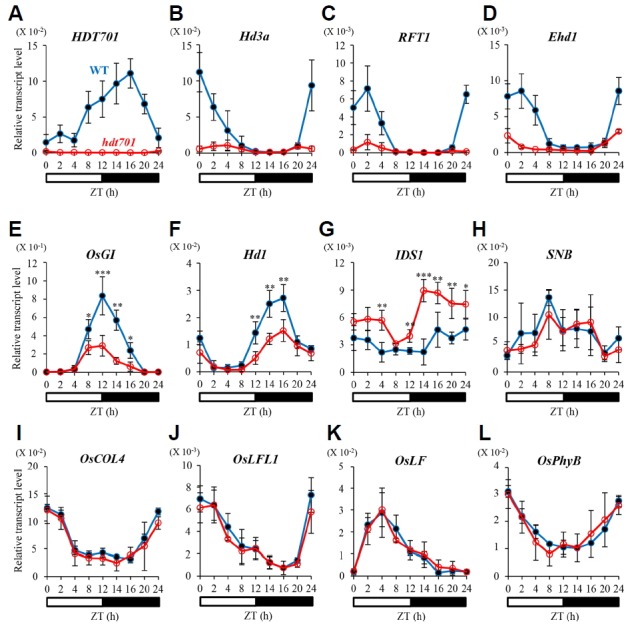
Fig. 4. Diurnal expression patterns of floral regulators in leaf blades of WT and hdt701-1 plants at 28 DAG under SD.

Quantitative RT-PCR analyses of HDT701 (A), Hd3a (B), RFT1 (C), Ehd1 (D), OsGI (E), Hd1 (F), OsIDS1 (G), SNB (H), OsCOL4 (I), OsLFL1 (J), OsLF (K), and OsPhyB (L). Closed circles, WT; open circles, hdt701-1. y-axis, relative transcript level of each gene compared with that of rice Ubi. Error bars indicate standard deviations; n = 4 (technical replicates). Levels of significant difference are indicated by * (P < 0.05), ** (P < 0.01), and *** (P <0.005).
