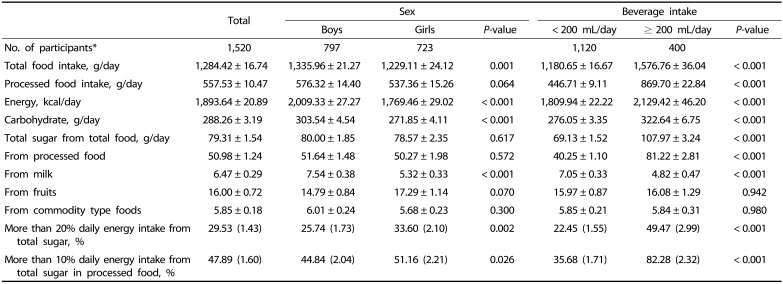
Table 2. Mean daily nutrient intake and total sugar intake from food sources of children aged 6–11 years in KNHANES (2013–2015) according to sex and beverage intake.
*Unweighted sample size
Data are presented as Mean ± Standard Error (SE) or % (SE).
P-value from t-test or chi-squared test
KNHANES: Korea National Health and Nutrition Examination Survey.

