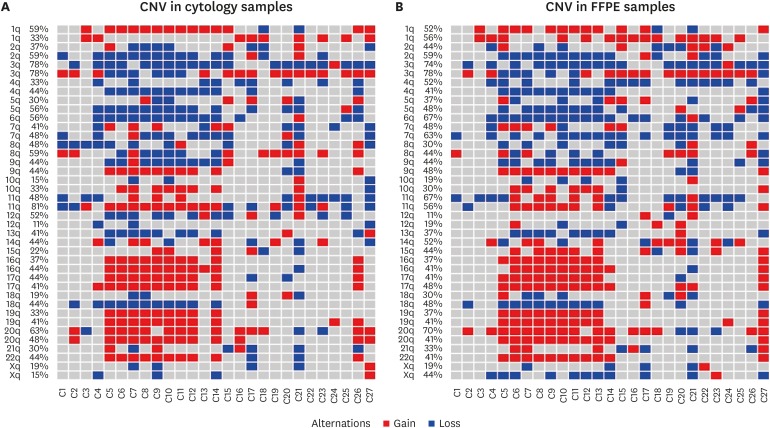
Fig. 2. Genomic instability in the samples of 27 cervical cancer cases. Red represents gains and blue represents losses. Columns are samples and rows are positions of the probes along the 22 autosomes. (A) Heatmap of CNAs in cytological samples. (B) Heatmap of CNAs in FFPE tissue samples.
CAN, copy number alteration; FFPE, formalin-fixed and paraffin-embedded.

