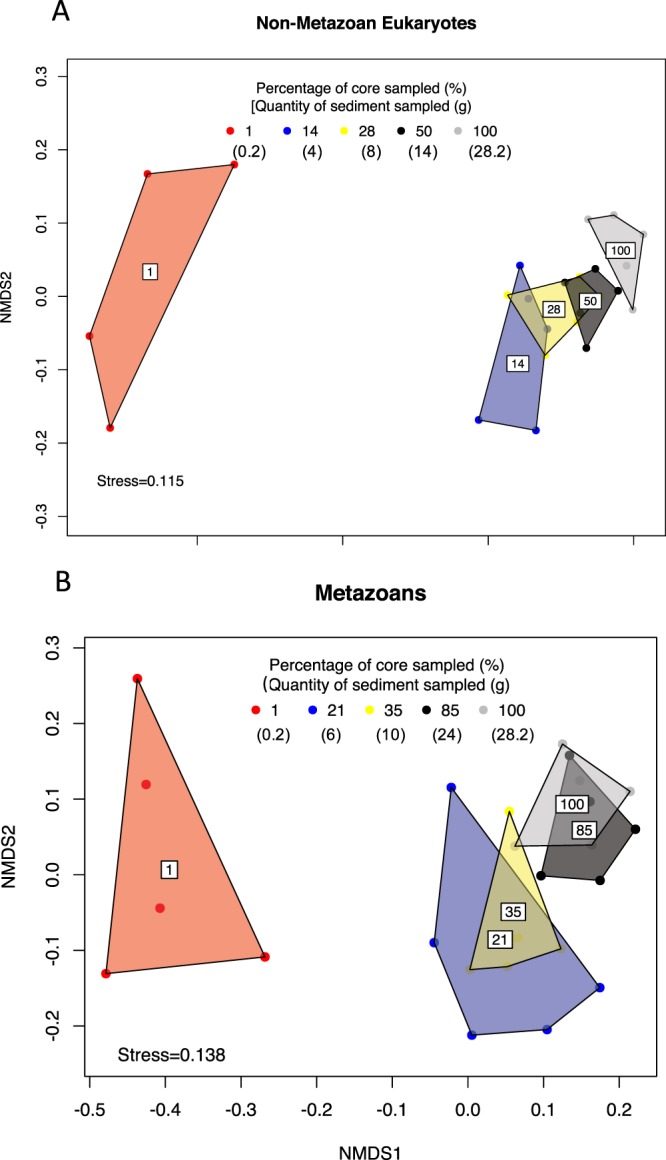
Figure 2.

Simplified non-metric multidimensional scaling (NMDS) analysis of the Sørensen beta-diversity matrix based on transformed OTU table for Non-Metazoan Eukaryotes (A) and Metazoans (B). Differences between the different treatments and the 100% treatment stopped being significant at 43% of sediment analyzed for Non-Metazoan Eukaryotes and in the 78% treatment for Metazoans (PERMANOVA, PERMDISP, see Table 1). For better visualization, only the treatment comprising 100% of the sampled volume, 3 treatments significantly different from the 100% treatment (1, 14, 28% for Non-Metazoan Eukaryotes and 1, 21 and 35% for Metazoans), and one treatment not significantly different from the 100% treatment (50% for Non-Metazoan Eukaryotes and 85% for Metazoans) are here shown. Data represents 96% OTUS.
