
Figure 3.
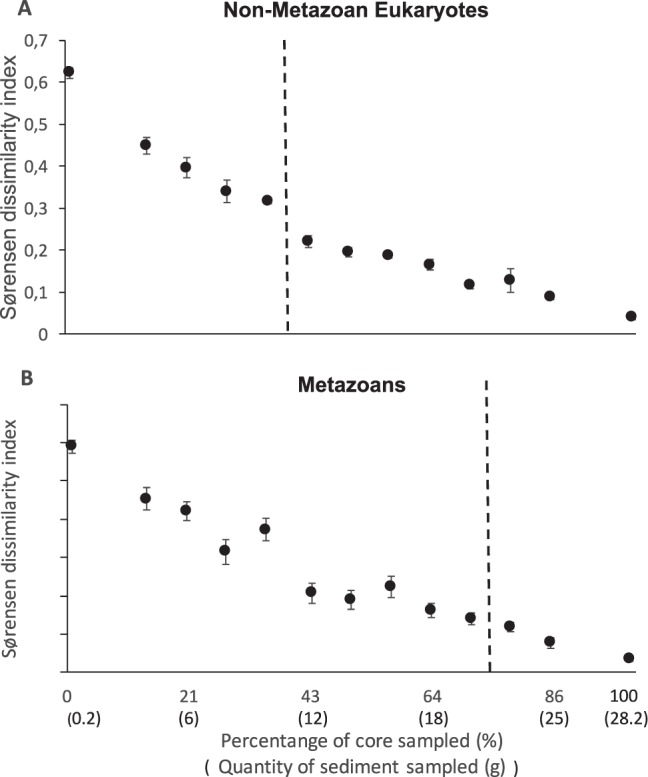
Average Sørensen dissimilarity index in each treatment in relation to the treatment where 100% of the sampled area was analyzed ((A)-Non-Metazoan Eukaryotes; (B)- Metazoans). Circles represent average dissimilarity in relation to the 100% treatment and error bars SE. Dotted line indicates the cutoff point after which the differences to the 100% treatment stop being significant (see Table 1). Sørensen dissimilarity index was calculated using transformed OTU data. Data represents 96% OTUS.