
Figure 5.
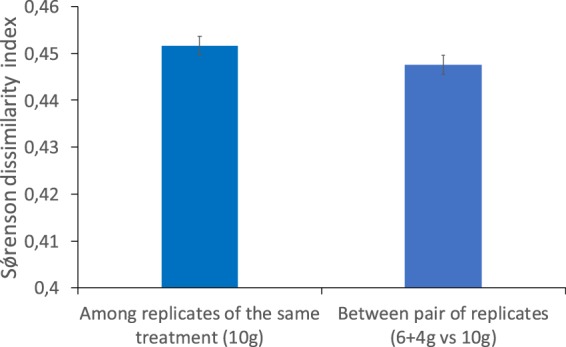
Average Sørensen dissimilarity index among replicates of the 10 g and distance between 10 g vs 6 g + 4 g of the same replicate (based on data for Metazoans). Data represents 96% OTUS.
Official websites use .gov
A
.gov website belongs to an official
government organization in the United States.
Secure .gov websites use HTTPS
A lock (
) or https:// means you've safely
connected to the .gov website. Share sensitive
information only on official, secure websites.
Average Sørensen dissimilarity index among replicates of the 10 g and distance between 10 g vs 6 g + 4 g of the same replicate (based on data for Metazoans). Data represents 96% OTUS.