Figure 7.

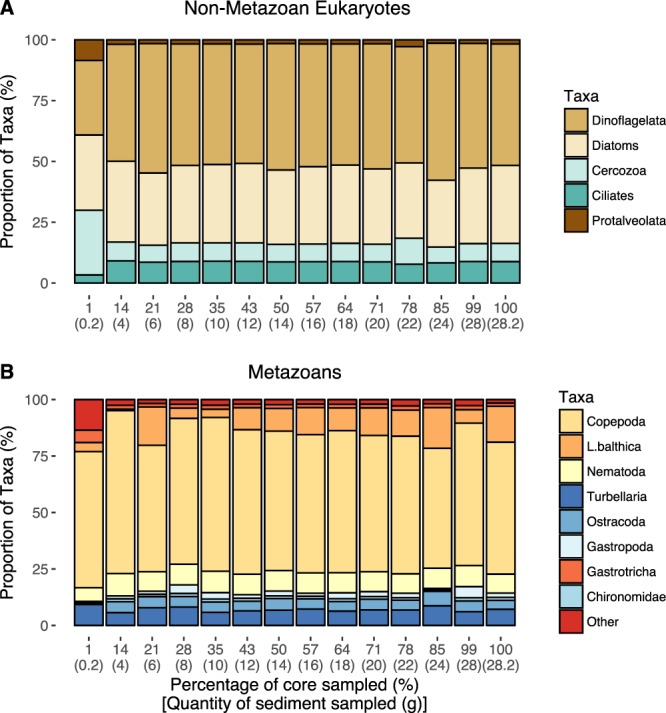
Proportion of the most abundant taxonomic groups in each treatment: (A) Top five most abundant Non-Metazoan Eukaryotes in each treatment; (B) Top nine most abundant Metazoan taxa in each treatment. Data represents 96% OTUs.

Proportion of the most abundant taxonomic groups in each treatment: (A) Top five most abundant Non-Metazoan Eukaryotes in each treatment; (B) Top nine most abundant Metazoan taxa in each treatment. Data represents 96% OTUs.