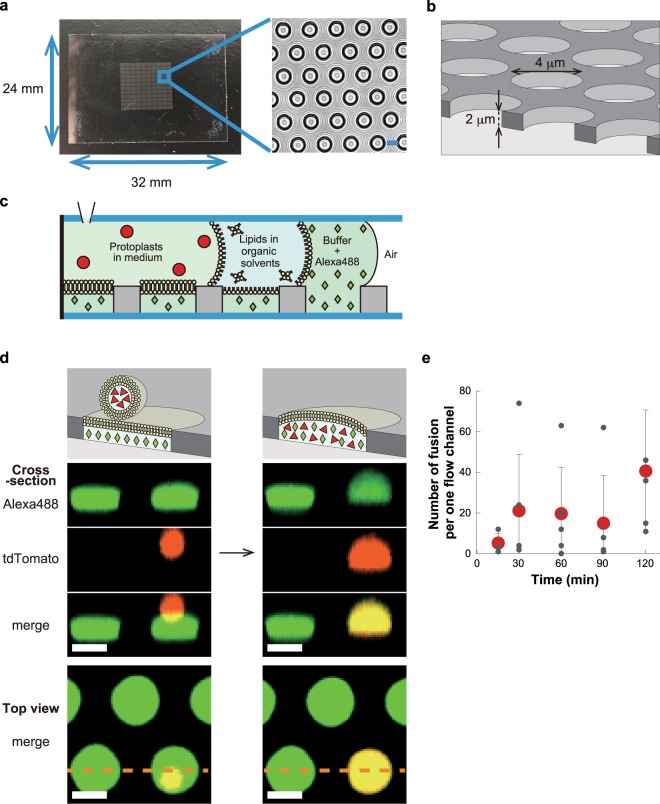
Figure 1.
Hybrid cells made from E. coli protoplast cell and arrayed lipid bilayer chamber (ALBiC). (a) ALBiC device viewed from top. The enlarged image is a bright field image of chambers. Scale bars are 4 μm. (b) Schematic illustration of ALBiC device. The diameter and depth of each reactor are 4 and 2 μm, respectively, and resultant volume is 25 femtoliter (=25 × 10−15 L). In this study, other devices with different size (4.5 μm in diameter and 3 μm in depth) were also used. (c) Schematic illustration of lipid bilayer formation viewed from side. A flow channel was composed of an ALBiC device and top cover glass with a spacer sheet. Media were sequentially introduced into a flow chamber from a hole in the top cover glass. After the lipid bilayer was formed on the top orifice of the chambers, protoplast cells were introduced with a culture medium. (d) Fusion process of protoplast cell. Schematic illustration (top) and experimentally recorded images (lowers). Alexa488 (green diamonds) emitting green fluorescence was encapsulated in ALBiC reactors to confirm that lipid bilayers were maintained. Red florescence represents E. coli protoplast cells expressing tdTomato protein (red triangles). When a protoplast cell was fused with an ALBiC reactor, red fluorescence spread throughout the reactor as shown. Cross-section images correspond to the side views of the reactors at the orange dotted line in the top views (bottom). Colocalization of red and green fluorescence confirmed mixing of the protoplast cytosol and the solution in an ALBiC reactor (indicated as a yellow signal in merge images). Upon the fusion, the total volume of hybrid cells increased and the hybrid cells resultantly formed a hemispherical shape. Scale bars are 4 μm. (e) Time course of fusion per flow channel. Time 0 was defined as the time of protoplast medium introduction into a flow channel. Gray and red dots indicate the number of fusion event in individual experiments and the averaged ones. Experiments were repeated 3–5 times. Error bars represent standard deviation.

