Figure 2.
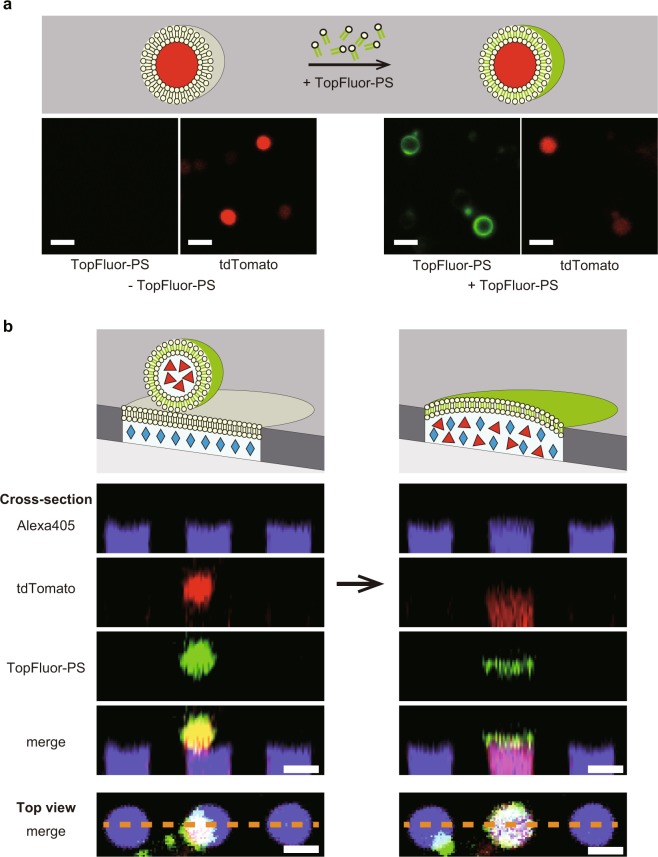
Fusion of membrane components of protoplast cells with ALBiC. (a) Staining of the protoplast membrane with the fluorescent-labeled lipid, TopFluor-PS. Schematic illustration (upper) and experimentally recorded images without and with the addition of TopFluor-PS (lower). (b) Fusion of the protoplast of fluorescent-labeled membrane. Schematic illustration (top) and experimentally captured images (lowers). Cross-section of top views (bottom) along the orange dotted lines. Alexa405 emitting cyan fluorescence (cyan diamonds) was encapsulated in ALBiC reactors. Red florescence represents E. coli protoplast cells expressing tdTomato protein (red triangles). The green signal from protoplast resulted from the membrane staining with TopFluor-PS. After fusion, red and cyan fluorescence signal colocalized in the reactor (indicated as a pink signal in merge images). Besides, green signal of TopFluor-PS localizes at the orifice of the reactor, showing fusion of the plasma membrane of protoplast and the lipid bilayer of ALBiC. Scale bars are 4 μm.

