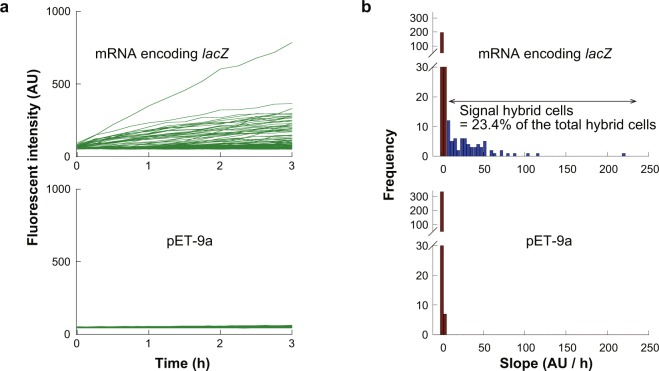
Figure 4.
Gene expression of hybrid cells from encapsulated mRNA. (a) Time courses of gene expression from lacZ-coding mRNA molecules encapsulated in ALBiC reactors (upper). Expression activity was monitored with SPiDER-βGal fluorescence as shown in Fig. 3. Control experiment using pET-9a (Fig. 3c) was also shown for comparison. (b) Histograms of fluorescence increment rate of hybrid cells. The upper shows the data from hybrid cells carrying lacZ-coding mRNA. The lower shows data of the control experiment (Fig. 3d). Red bins indicate inactive chambers defined from the histograms of the control experiment. Gray bins indicate the number of hybrid cells with no β-gal signal, while blue bins indicate the number of hybrid cells with β-gal signal. The total number of hybrid cells active for expression of β-gal signal was 23.4%.

