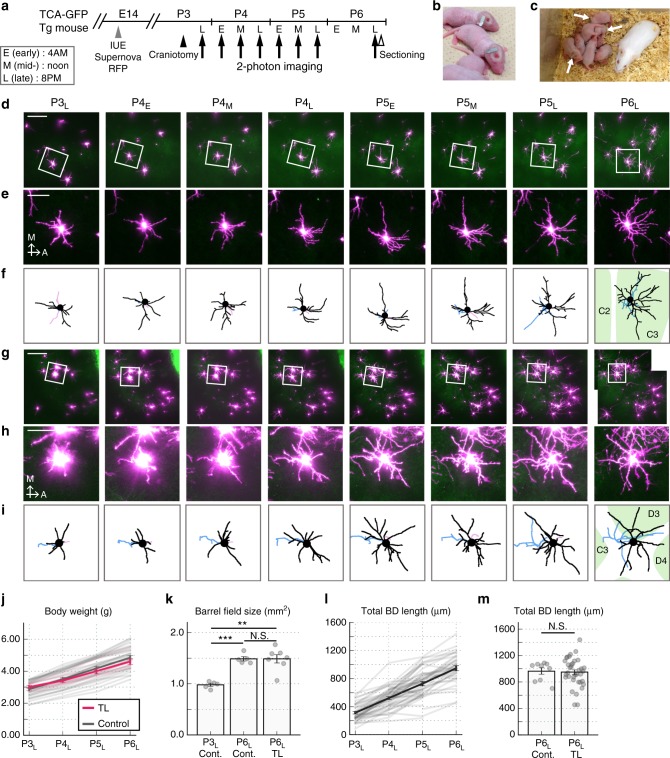
Fig. 1.
Long-term in vivo imaging of cortical L4 neurons in neonates. a Schematic drawing of the in vivo time-lapse imaging between P3 and P6. IUE in utero electroporation. b A very light (~20 mg) and small (7 × 2 × 0.5 mm) titanium bar was used. c Representative image of pups (at P6) used for 3-d-long imaging (time-lapsed (TL) pups) (arrows). During imaging intervals, TL pups received maternal care with other littermates. d Representative Z-stack images of Supernova-RFP-labeled L4 neurons (magenta) and EGFP signals in TCA-GFP Tg mice. e Higher-magnification images of the neuron shown in (d) (square). A anterior, M medial. f Basal dendrites (BDs: black), apical dendrite (AD: red), and axon (blue) of the neuron were traced and reconstructed in three dimensions. Barrel map (green) determined by EGFP signal was shown (see Supplementary Fig. 1c). g–i Another set of representative case corresponding to (d–f). j Body weight change of TL (n = 6) and control (n = 29) pups (mean ± SEM (dense) and individual (faint)). P3L-TL vs. P6L-TL: p < 0.001, g = 4.369, Paired t-test. P6L-TL vs. P6L-control: p = 0.312, g = 0.348, Welch’s t-test. k Barrel field areas were measured in tangential sections prepared from TL pups (n = 7) immediately after P6L imaging. As controls, normal pups at P3L (n = 5) and P6L (n = 5) were used. P3L-control vs. P6L-control: p < 0.001, g = 6.131; P3L-control vs. P6L-TL: p = 0.001, g = 2.913; P6L-control vs. P6L-TL: p = 0.995, g = 0.003; Welch’s t-test with Holm’s correction. l Increase of total BD length of TL pup L4 neurons during 3-d-long imaging (n = 51 neurons from eight mice). Mean ± SEM (dense) and values of individual neurons (faint) were shown. m Total BD length of L4 neurons of TL (n = 36 neurons from six mice) and control (n = 9 neurons from two mice) pups at P6L (p = 0.795, g = 0.078, Welch’s t-test). This analysis was done by in vivo imaging. For control pups, a cranial window/titanium bar was attached at P6L. Error bars: SEM. Scale bars: 150 µm (d, g) and 50 µm (e, h)

