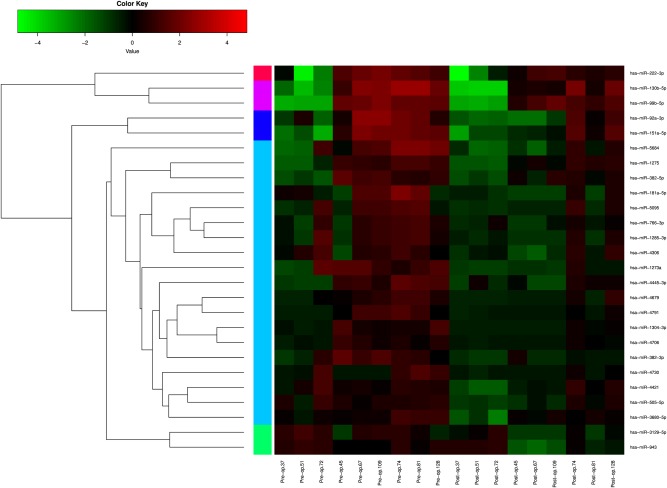
Fig. 1. Heat map and hierarchical clustering of downregulated miRNA expression signatures compared postoperative with preoperative signatures in nine matched-pair breast cancer patients’ samples.
Each row represents a miRNA, and each column represents a sample. The miRNA clustering tree is shown on the left. The color scale shown on the top illustrates the relative expression level of a miRNA in a certain slide: red color represents a high relative expression level and green color represents a low relative expression level. Those miRNAs whose fold change is more than 1.5 and P value less than 0.05 are listed here

