
Fig. 5.
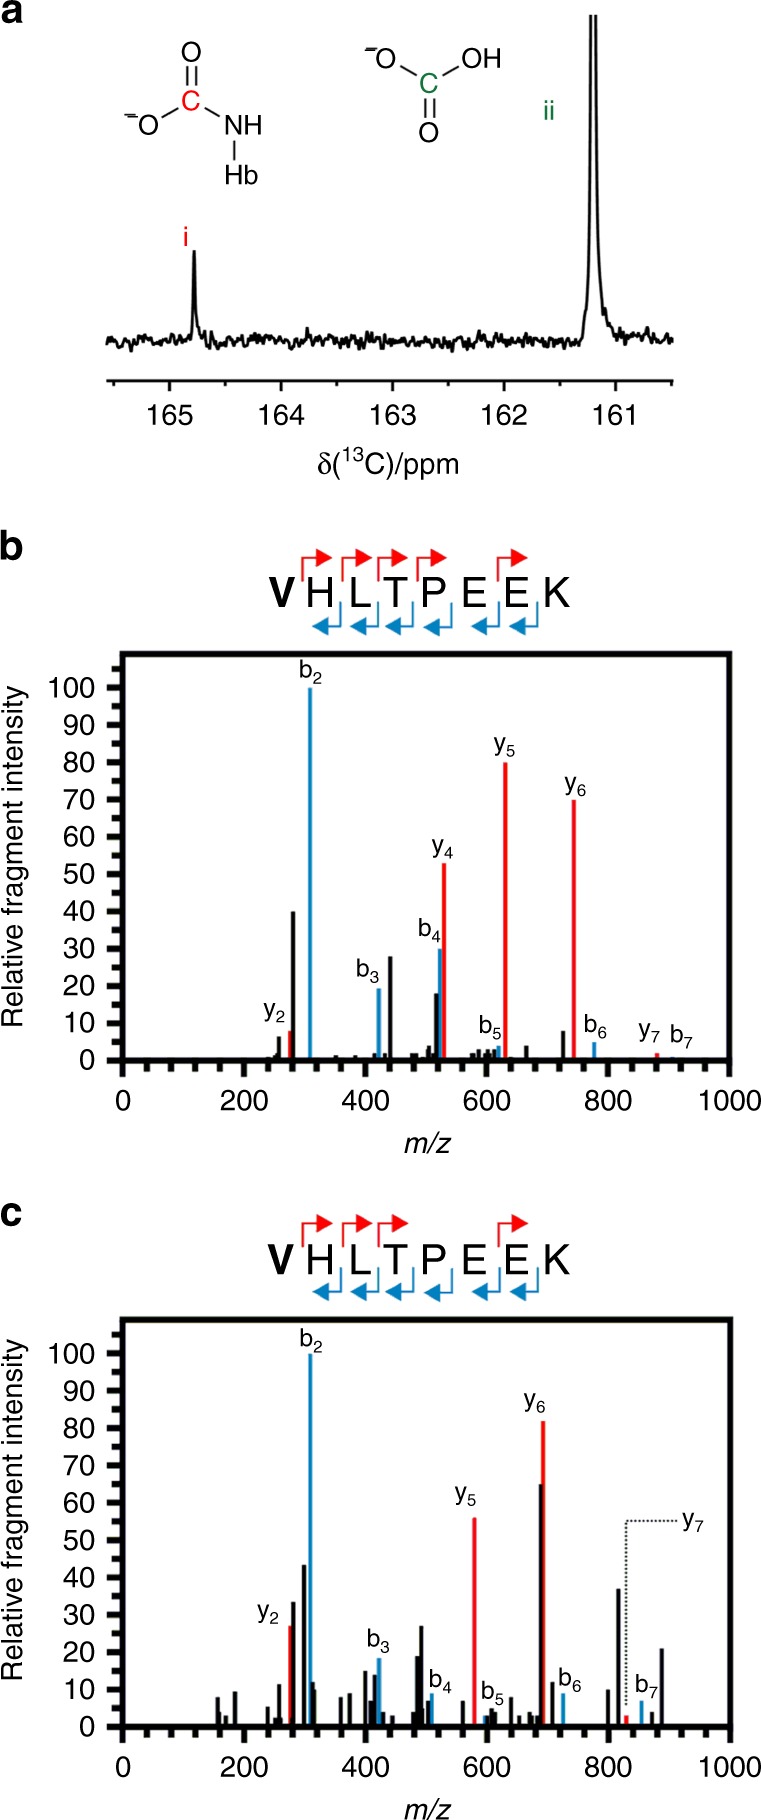
Identification of the exchangeable CO2-binding site on haemoglobin. a 13C-NMR spectrum demonstrating the formation of a carbamate on haemoglobin by the appearance of a peak at 164 ppm (i) together with a peak from H13CO3− in solution (ii). b A plot of relative fragment intensity versus mass/charge ratio (m/z) for fragmentation data from MS-MS identifying an ethyl-trapped carbamate on the N-terminal valine of the haemoglobin β-chain. The experiment used purified haemoglobin. The peptide sequence above indicates the identification of predominant +1y (red) +1b (blue) ions by MS-MS shown in the plot. The modified residue is indicated in bold. The experiment also identifies a further ethylation on E7. c A plot of relative fragment intensity versus mass/charge ratio (m/z) for fragmentation data from MS-MS identifying an ethyl-trapped carbamate on the N-terminal valine of the haemoglobin β-chain. The experiment used whole red blood cells. The peptide sequence above indicates the identification of predominant +1y (red) +1b (blue) ions by MS-MS shown in the plot. The modified residue is indicated in bold