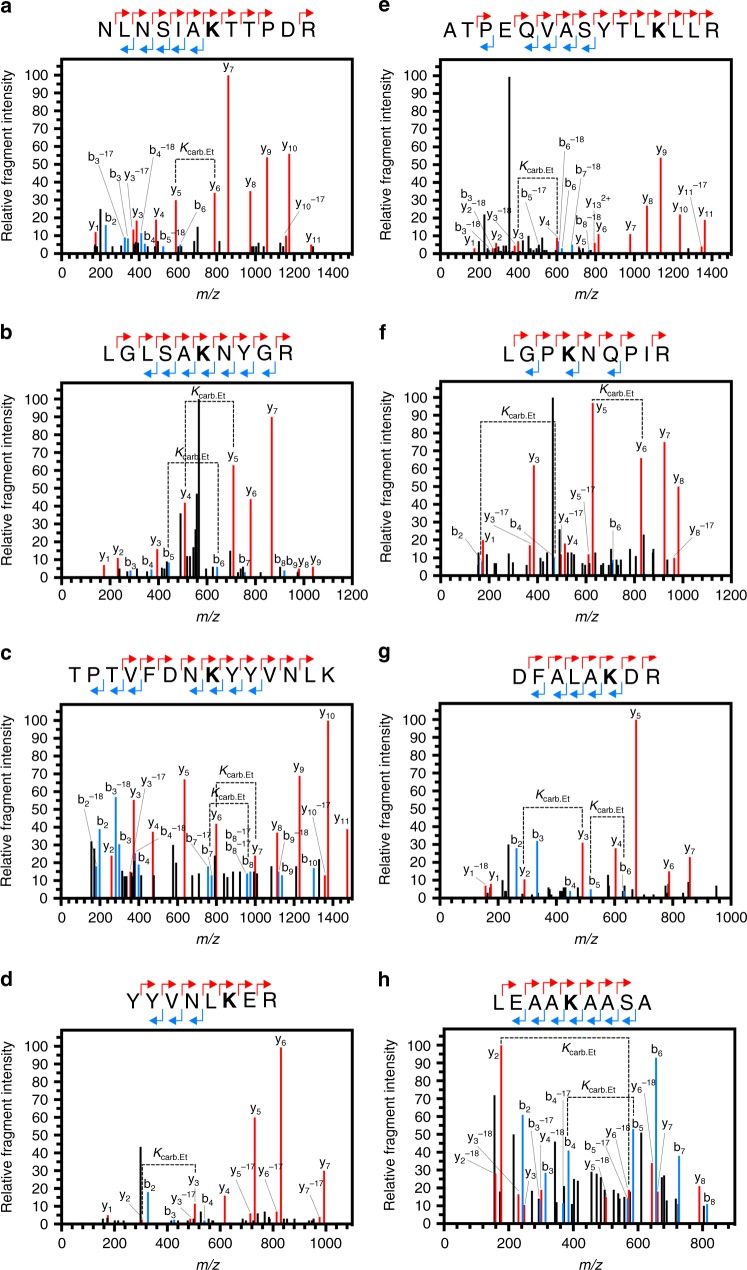
Fig. 7.
The identification of CO2-binding proteins. MSMS spectra of peptides that were identified with ethyl-trapped carbamates on Lys residues. Panel b is a CID spectrum acquired on an LTQ Orbitrap XL mass spectrometer (low resolution), panel e was acquired on a QStar Pulsar mass spectrometer QqTOF with intermediate resolution and panels a, c, d, f–h are CID spectra acquired on a high resolution QqTOF mass spectrometer (Sciex TT6600). The peptide sequences above each panel indicate the assignment of predominantly singly charged y (red) and b (blue) ions. The modified residue is indicated in bold. Kcarb.Et indicates the molecular weight difference between ions diagnostic of the modified lysine. a Lysine 65 of At2g38540. b Lysine 183 of AtCG00490. c Lysine 262 of At3g49120. d Lysine 268 of At3g49120. e Lysine 293 of At2g21330. f Lysine 251 of At3g54400. g Lysine 109 of At4g21280. h Lysine 208 of At4g25100

