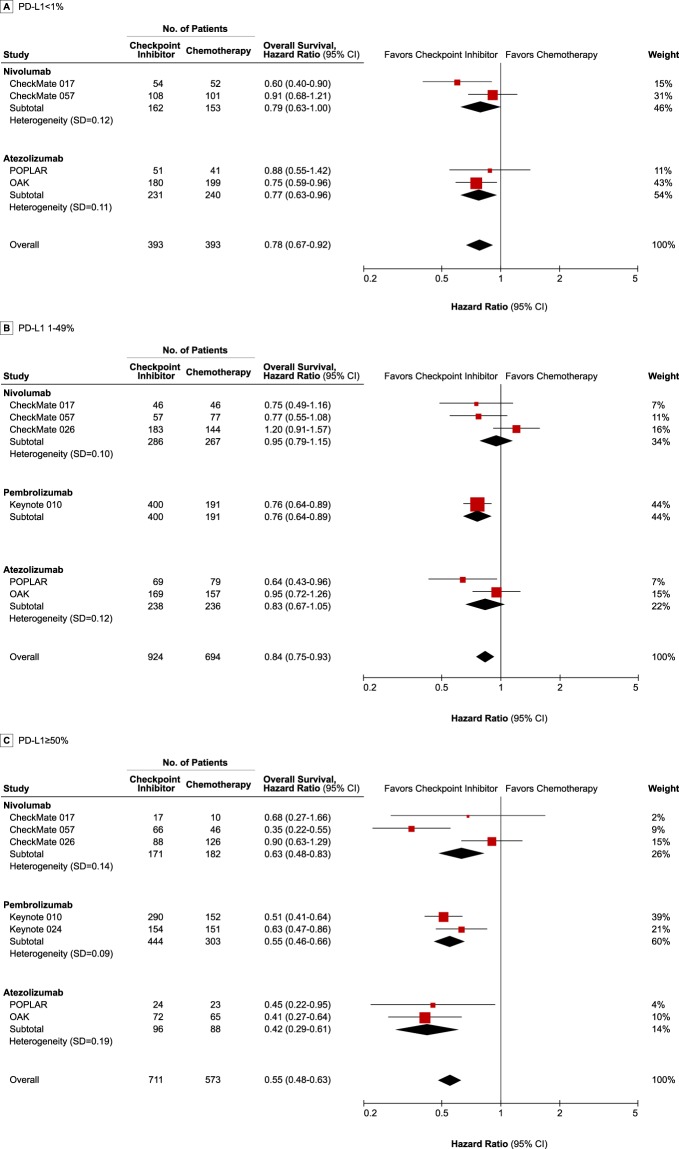
Figure 2.
Forest plot of meta-analysis comparing checkpoint inhibitors vs chemotherapy for overall survival by PD-L1 expression. The size of the squares reflects the weight of the study in the meta-analysis. The effect size of individual trial represents the extracted hazard ratio and 95% confidence interval, and pooled effect-size represents the combined hazard ratio and 95% credible interval from meta-analysis. The combined effects were calculated with a Bayesian fixed-effect model. PD-L1: programmed death-ligand-1.

