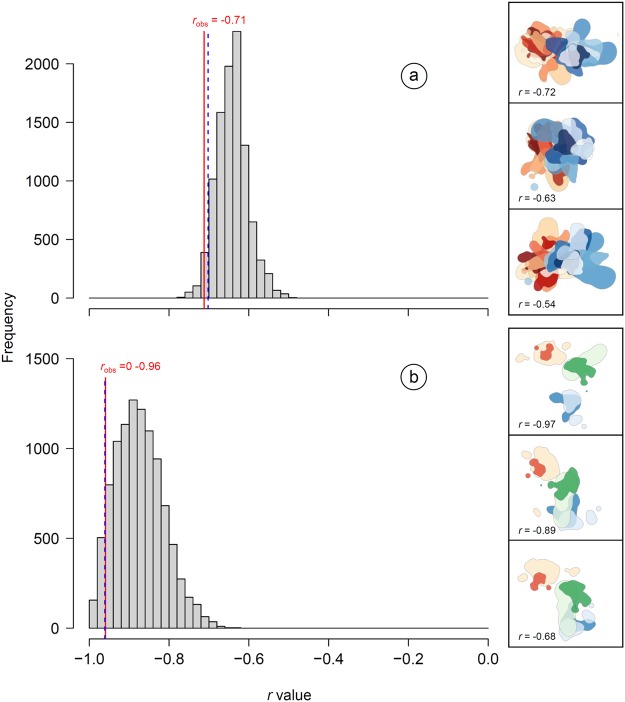
Figure 3.
Frequency distribution of randomized r values obtained from random rotations of home ranges (with breeding site as the anchor point) in a) Apulia and b) Sicily. r values were computed by correlating the matrix of Utilization Distribution Overlap Index (UDOI) values with the matrix of colony membership (0 = individuals belonged to the same colony; 1 = individuals belonged to different colonies) (see Methods for details). More negative r values denote greater spatial segregation of home ranges between lesser kestrels from neighbouring colonies (see Fig. 2). The observed r value (robs), resulting from the spatial distribution of home ranges shown in Fig. 2, is highlighted with a (continuous) red line within each panel. The 95% empirical quantile of the frequency distribution of randomized r values is shown with a (broken) blue line. Representative examples of random rotations of home ranges (and the corresponding r value) for each study population are shown on the right insets of each panel (home ranges of birds from different colonies are depicted with colour shadings corresponding to those used in Fig. 2); for simplicity, overlapping home ranges are represented with 95% KDEs.

