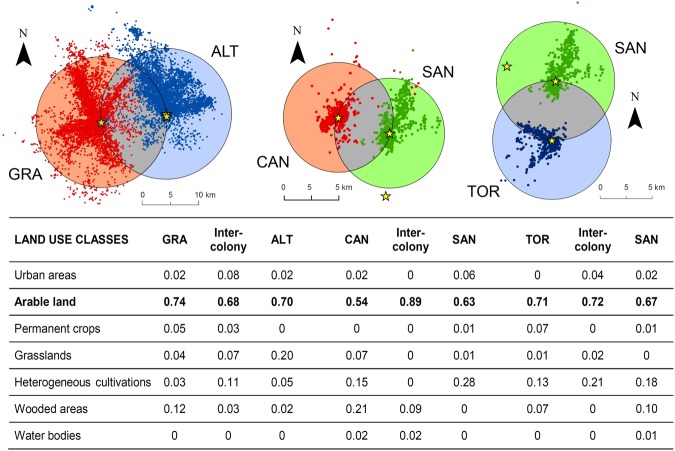
Figure 4.
Proportion of land use classes within outer- (orange, blue or green areas) and inter-colonies areas (grey areas). Points represent all recorded GPS positions for a given colony (different colours for neighbouring colonies) and stars represent breeding sites of GPS-tagged birds in each colony (GRA = Gravina in Puglia, ALT = Altamura, CAN = Canalotto, SAN = Sangregorio, TOR = Torrevecchia). The radius of each buffer around colonies (centered on the mean of breeding sites positions) was calculated as the distance between the two neighbouring colonies. Land use classes were identified by means of ArcGIS 10.2.1 for Desktop according to the Corine Land Cover 2012 classification. Arable land (in bold) represents the main foraging habitat for the lesser kestrel in the study areas.

