Fig. 4.
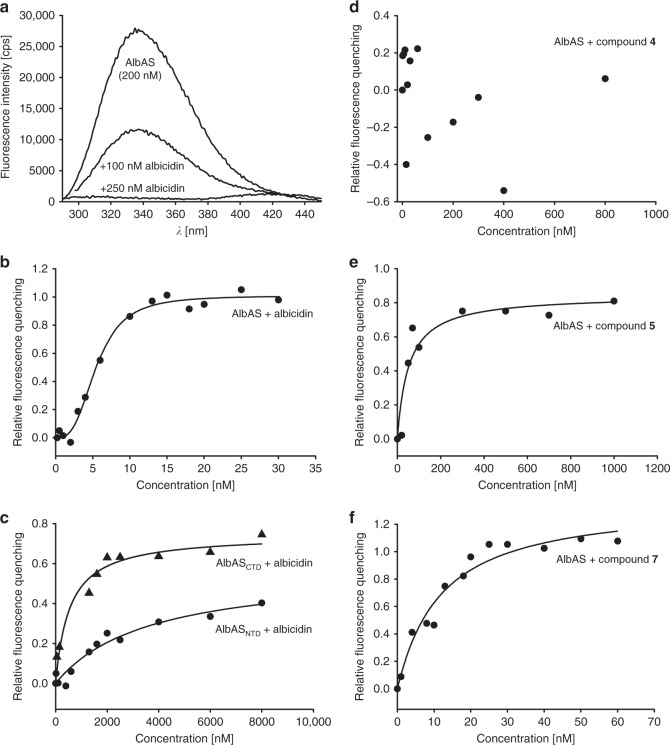
Determination of binding affinities by monitoring quenching of fluorescence emission of AlbAS. a Fluorescence quenching of AlbAS (200 nM; λexc = 280 nm) with increasing albicidin concentrations. b Nonlinear regression (Eq. (2), see Methods section) of fluorescence quenching data yielding a Kd of 5.6 ± 0.2 nM and a Hill coefficient, n, of 3.0 ± 0.5 for the interaction of albicidin with AlbAS (20 nM). c Nonlinear regression of the quenching data yielded Kd values of 3.4 ± 0.2 and 0.6 ± 0.1 µM for the interaction of albicidin with the dissected domains AlbASNTD (100 nM) and AlbASCTD (100 nM), respectively. d AlbAS (20 nM) titrated with compound 4 did not lead to significant quenching of the fluorescence emission signal. e Titration of AlbAS (20 nM) with compound 5 yielded a Kd of 55.5 ± 3.6 nM (Eq. (2), see Methods section). f Titration of AlbAS (20 nM) with compound 7 yielded a Kd of 14.0 ± 2.9 nM (Eq. (3), see Methods section). Representative binding curves are shown for two independent experiments each. Errors are given as s.d

