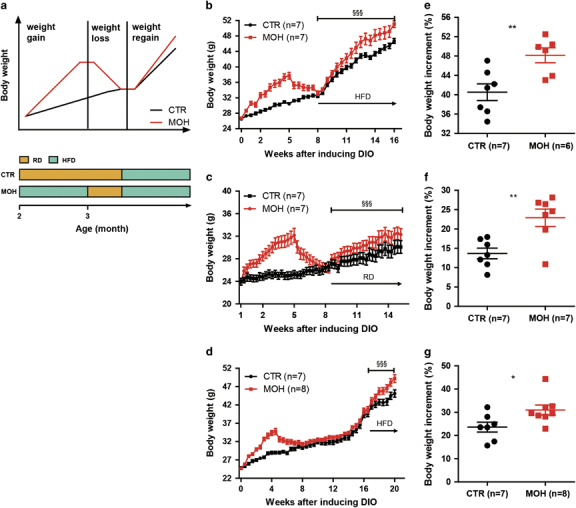
Figure 1.

Weight gain-loss-regain model and long-term obesity memory. The DIO model in C57BL/6J mice was established as per the simulative graph and timeline (a). Body weight curves (b–d) and body weight increment ratios during the weight regain period (e–g) were recorded to display obesity memory. Weight regain was induced with a HFD (b, e and d, g) and a RD (d, f). The data are shown as means±s.d. *P<0.05 and **P<0.01, unpaired Student’s t-test. §§§ P<0.001, two-way ANOVA followed by the Bonferroni post hoc test. CTR, control group; DIO, diet-induced-obesity; HFD, high fat diet; MOH, obesity history group; RD, regular diet.
