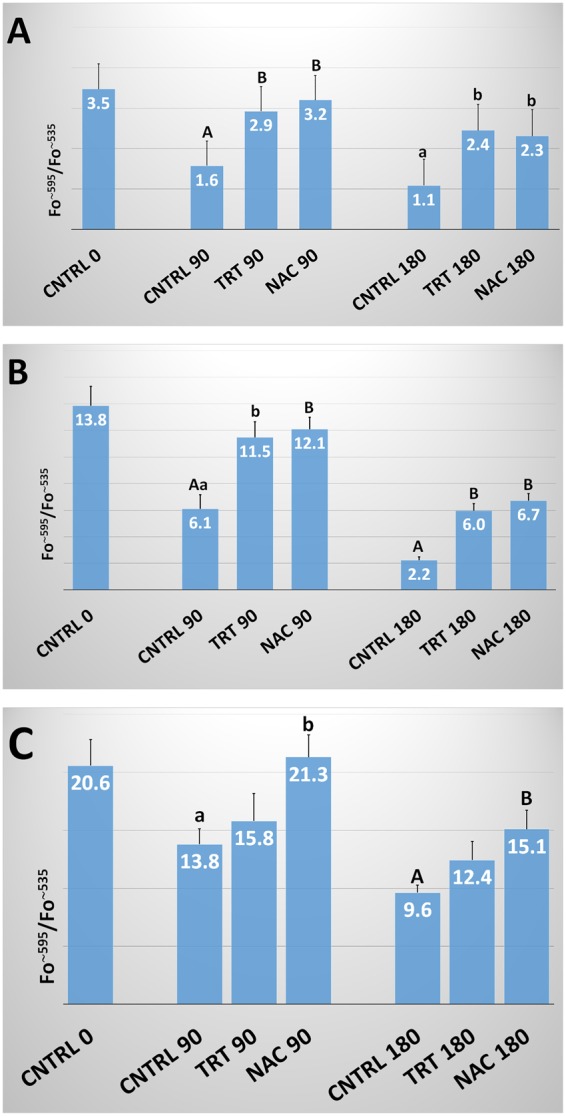
Figure 2.

ΔΨM in human, bovine and ascidian spermatozoa exposed to metabolic enhancers. Mitochondrial membrane potential (ΔΨM) in human (A), bovine (B) and ascidian (C) sperm divided in three groups treated with: (1) five metabolic enhancers (vitamins B6 and B12, 5 methyl THF, zinc and N-acetyl cysteine) (TRT group); (2) n-acetyl-cysteine (NAC group); and (3) medium alone (CNTRL group). Mean (±SE) values of ΔΨM in spermatozoa loaded with JC-1, arranged in TRT, NAC and CNTRL groups and then incubated for 0, 90 and 180 min. The fluorescence emission peak (Fo) was measured at ~595 and ~535 nm and expressed as Fo~595/Fo~535. Statistically significant differences between groups for each evaluated time point are expressed as different capital (A vs. B; P < 0.01) and small (a vs. b; P < 0.05) letters.
