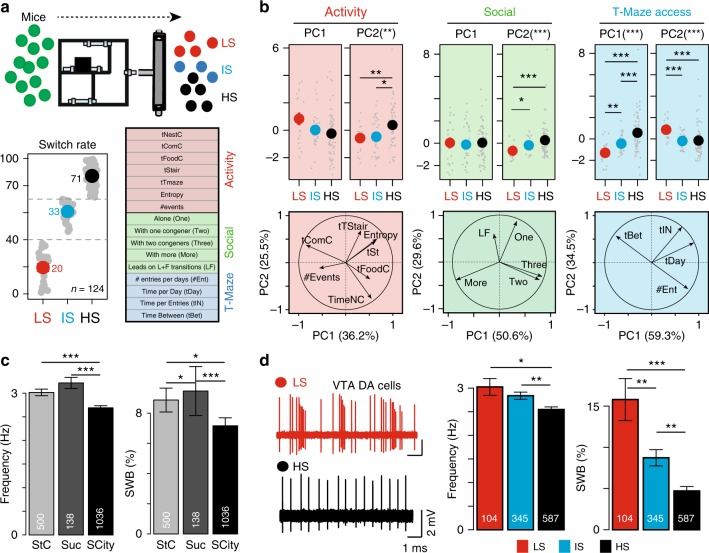
Fig. 4.
Correlation between specific cognitive behaviors and electrophysiological properties of the DA system. a Different groups of mice (10 groups, n = 124 mice) were tracked during the S2 in Souris City and classified according to their SW in three groups (i.e., low (LS), intermediate (IS), and high switch (HS) rates). Sixteen variables categorized in three groups were estimated: general activity, social, and T-maze access variables. b (Top) Correlation between principal component PC1 and PC2 for typical behaviors and SW. (Bottom) Correlation circle plots for the first two principal components (PC1 and PC2) with the different variables represented by their projections. (Left) General activity variables (X2 = 13.101, df = 2, p-value = 0.0014 for PC2). (Middle) Social variables (X2 = 14.972, df = 2, p-value = 0.00056 for PC2). (Right) T-access variables (X2 = 32.046, df = 2, p-value < 0.001 for PC1; X2 = 18.86, df = 2, p-value < 0.001 for PC2). c (Left) Spontaneous DA cell activity in standard cages with water (StC), sucrose (5%) or in Souris City (SCity) (frequency: X2 = 32.714, df = 2, p-value < 0.001; %SWB: X2 = 17.172, df = 2, p-value < 0.001). d (Left) Representative electrophysiological recordings of DA cells from LS (above) and HS mice (below). (Right) VTA DA neuron firing activity of the three groups (X2 = 13.601, df = 2, p-value = 0.0011 for frequency, X2 = 26.919, df = 2, p-value < 0.001 for %SWB). All Kruskal–Wallis were followed by a pairwise Wilcoxon post-hoc test with a Holm’s correction. All data are presented as mean ± sem, ***p < 0.001, **p < 0.01, *p < 0.05

