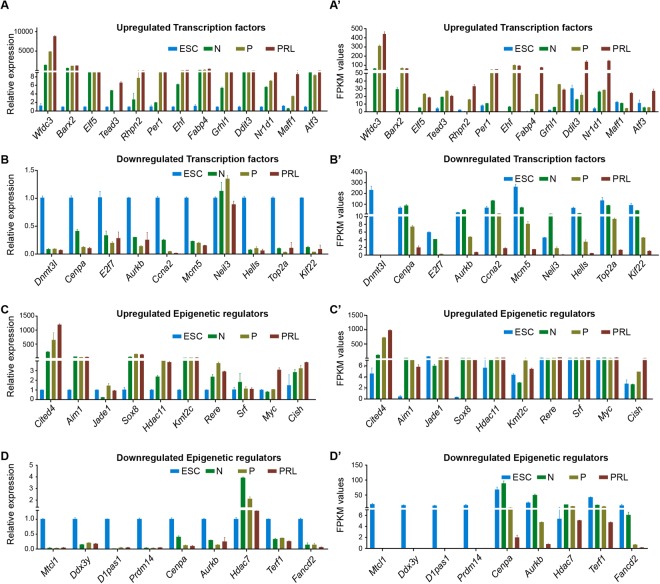
Figure 6.
Real-time PCR validation of top up or downregulated TFs and ERs in ESC and HC11 MEC undergoing lactogenic differentiation. (A) Bar chart showing real-time PCR measured relative expression of upregulated and (B) downregulated TFs along with its respective RNA-seq FPKM values (A’ and B’) in ESC, N, P and PRL treated HC11 cells. (C) Bar chart showing real-time PCR measured relative expression of up-regulated and (D) down-regulated ERs along with its respective RNA-seq FPKM values (C’ and D’) in ESC, N, P and PRL treated HC11 cells.

