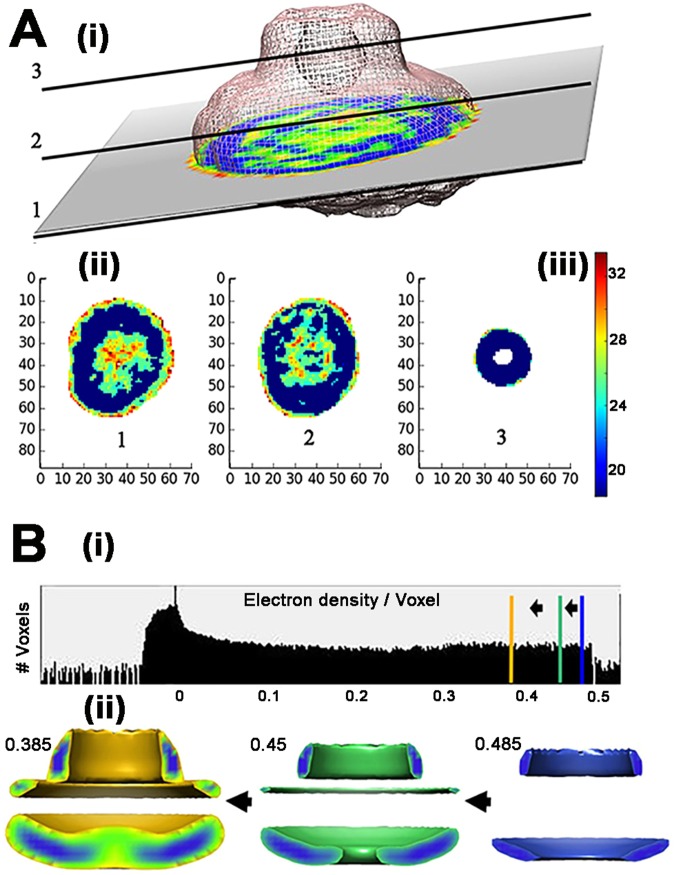
Figure 1.
High-density sub-volumes in the 3D EM reconstruction. (A) ResMap59 was used to compute local resolution. (i) 2D slices taken at three positions (1,2,3) in the 3D-reconstruction with color-coded estimated local resolution. (ii) Local resolution maps of the three slices. Distance in nanometers. (iii) Vertical bar shows color scale for the local resolution (in angstroms). (B) (i) Density distribution of the rotationally averaged reconstruction77. Vertical bars show electron density thresholds used for the half-maps (blue = 0.475, green = 0.45, gold = 0.385). (ii) Changes in the rotationally-averaged map as threshold is decreased from 0.475 (volume = 0.76*(10^6) cubic angstroms) to 0.45 (volume = 2.14*(10^6) cubic angstroms) to 0.385 (volume = 5.93*(10^6) cubic angstroms).

