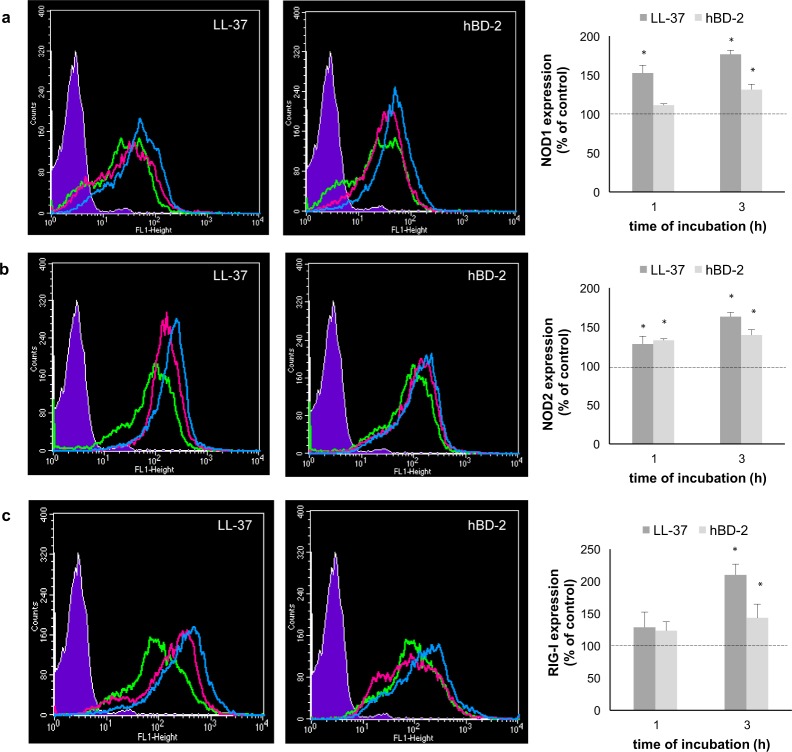
Figure 2.
Effect of LL-37 and hBD-2 stimulation on (a) NOD1, (b) NOD2, (c) RIG-I expression in PMCs. PMCs were incubated with medium alone (non-stimulated cells; NS), LL-37 or hBD-2 at a final concentration of 1 µg/mL. Left panel: Representative flow cytometry histogram showing NOD1, NOD2, and RIG-I expression. Shaded tracings – isotype control, open tracings – receptor expression in native cells (green) and after LL-37/hBD-2 stimulation for one h (violet) and three h (blue). Right panel: Constitutive receptor expression served as a control and was referred to as 100%. The results are presented as percentage of constitutive receptor expression. Data represents the mean ± SD of three independent experiments performed with duplicate samples (each experiment was performed on 4 animals/PMC isolates). Differences were considered significant at P < 0.05 and are labeled with an asterisk (*) on each graph (Student’s t-test).

