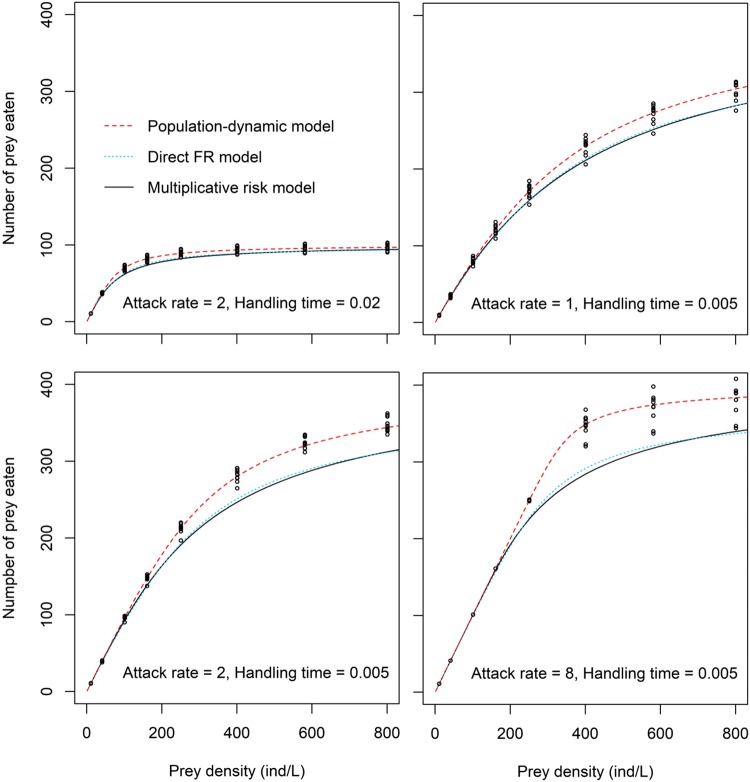
Figure 1.
Simulated number of prey eaten over 24 hours by two conspecific predators under the assumption of independent predator effects on prey survival (black dots) for different values of attack rate and handling time. Lines represent predictions from the multiplicative risk model (solid black line), the direct FR model (dotted blue line) and the population-dynamic model (dashed red line). Range of values used for attack rate and handling time were chosen to reflect values found in previous studies conducting both a functional response experiment and multiple predator trials10,20.

