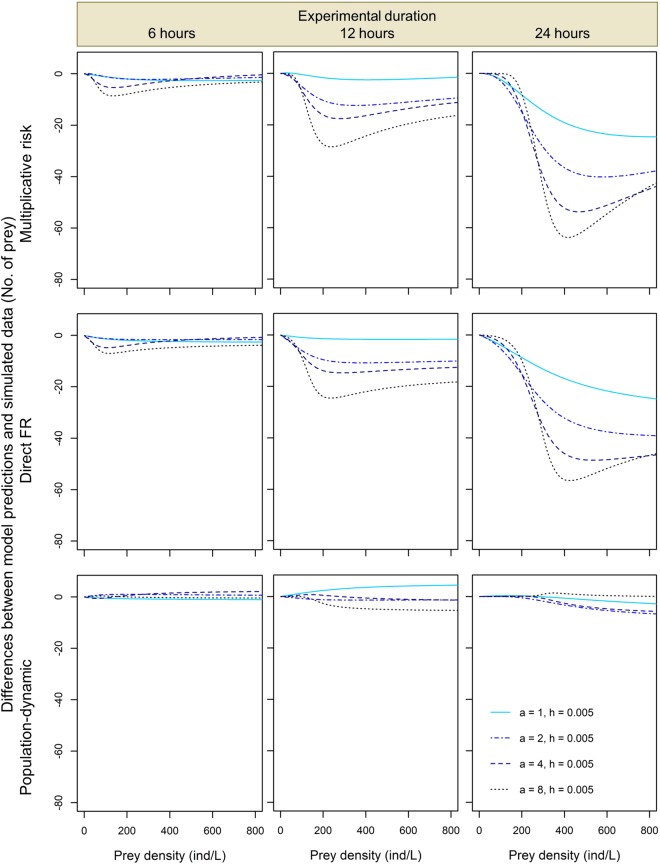
Figure 3.
Pairwise differences expressed as differences in the number of eaten prey between model predictions and simulated data for two conspecific predators for the multiplicative risk model, the direct FR model and the population-dynamic model (top, middle and bottom row, respectively) in experiments lasting 6, 12 and 24 hours (left, middle and right column, respectively) for different values of attack rate a. Handling time h = 0.005 in all simulations.

