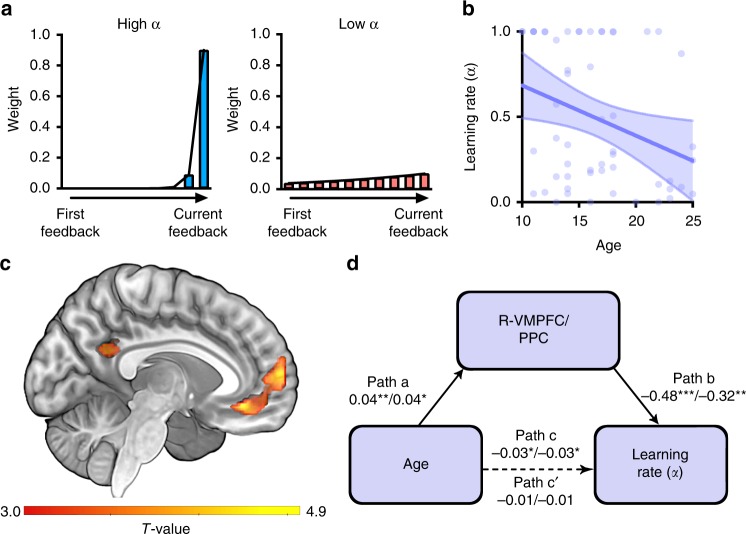
Fig. 4.
Analyses with reinforcement learning (RL) model. a Illustration of the relationship between the learning rates (high and low) from RL model and differential impact of the current and previous feedback on partner-evaluation at the current trial (tenth trial in this illustration; for mathematical illustration, see Eq. (3)). b Negative association between age and learning rate. Purple circles, line, and band indicate individuals’ learning rates, the best fitted line and 95% confidence interval band, respectively. c Statistical parametric map depicting RMPFC extending into VMPFC (whole brain and SVC FWE < 0.05) signals and PPC (whole-brain FWE < 0.05) coding prediction error (PE) signals which were negatively associated with learning rate (see also Supplementary Table 2). d Age-related decrease in learning rate was mediated by the PE-related parametric modulation estimates of R-VMPFC and PPC (c). (Regression coefficients before and after the slash correspond to R-VMPFC and PPC, respectively. *p < 0.05, **p < 0.01; Bootstrapping mediation analysis)

