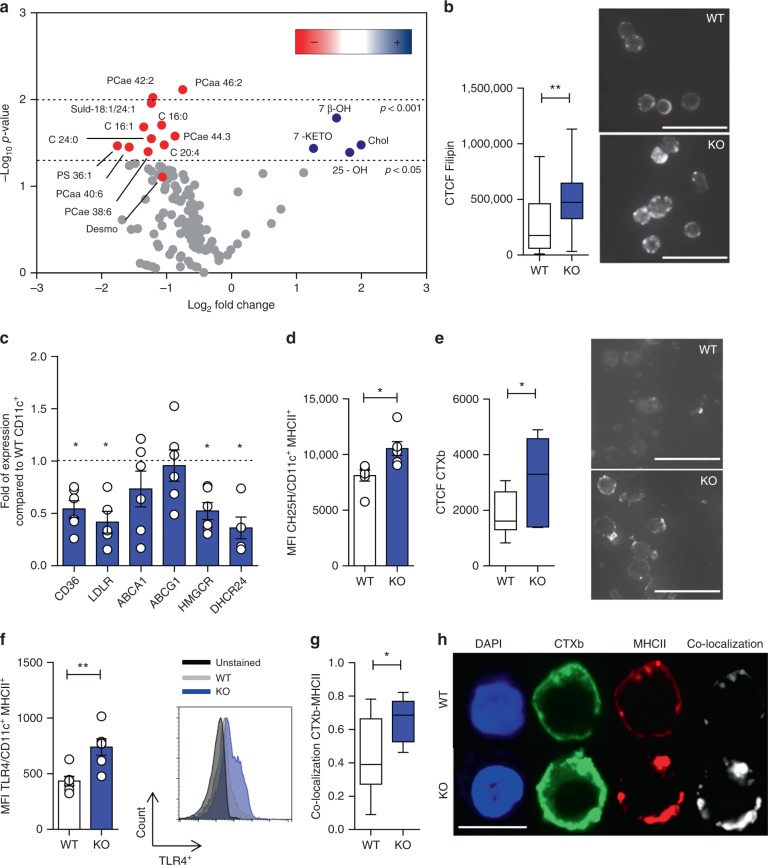
Fig. 5.
ApoE deficiency affects lipid composition of DCs. a Volcano plot from extensive lipidomic analysis (fatty acids, phospholipids and oxysterols) in purified CD11c+ DCs isolated from the spleen of WT or apoE KO mice. The volcano plot correlates fold-change expression (expressed as log2) and significance between two groups (WT vs. apoE KO), using a scatter plot view. The y-axis is the negative log10 of p-values (a higher value indicates greater significance as indicated by dashed lines) and the x-axis is the difference in levels of metabolites between two experimental groups. Metabolites which are significantly increased are shown by blue dots while red dots represent those decreased. b Total cell fluorescence (CTCF) of free cholesterol (filipin staining) in purified CD11c+ DCs isolated from the spleen of WT or apoE KO mice, calculated with ImageJ software; representative pictures are shown (×20 magnification, scale bar 25 µm). c Expression of CD36, LDLR, ABCA1, ABCG1, HMGCR and DHCR24 mRNA by purified CD11c+ DCs isolated from the spleen of WT or apoE KO mice. d Mean fluorescence intensity (MFI) of CH25H in CD11c+ MHCII+ DCs of WT and apoE KO determined by flow cytometry. e Total cell fluorescence (CTCF) of lipid rafts (CTXb) in purified CD11c+ DCs isolated from the spleen of WT or apoE KO mice, calculated with ImageJ software; representative pictures are presented (×20 magnification, scale bar 25 µm). f Median fluorescence intensity (MFI) of TLR4 expression in CD11c+ MHCII+ DCs of WT and apoE KO determined by flow cytometry; representative histograms are shown. g and h Pearson’s correlation coefficient between lipid rafts (CTXb) and MHCII calculated with ImageJ software (g) in purified CD11c+ DCs isolated from the spleen of WT or apoE KO mice; representative pictures from confocal microscopy staining for CTXb (green), MHCII (red) and DAPI (nucleus, blu) are presented in h (×63 magnification, scale bar 10 µm). N = 4 (a, b, e) and N = 6 (c, d, f–h) per group. Statistical analysis was performed with unpaired T-test. Data are reported as mean ± SEM; box and whiskers shown min to max values; *p < 0.05, **p < 0.01

