Fig. 5.
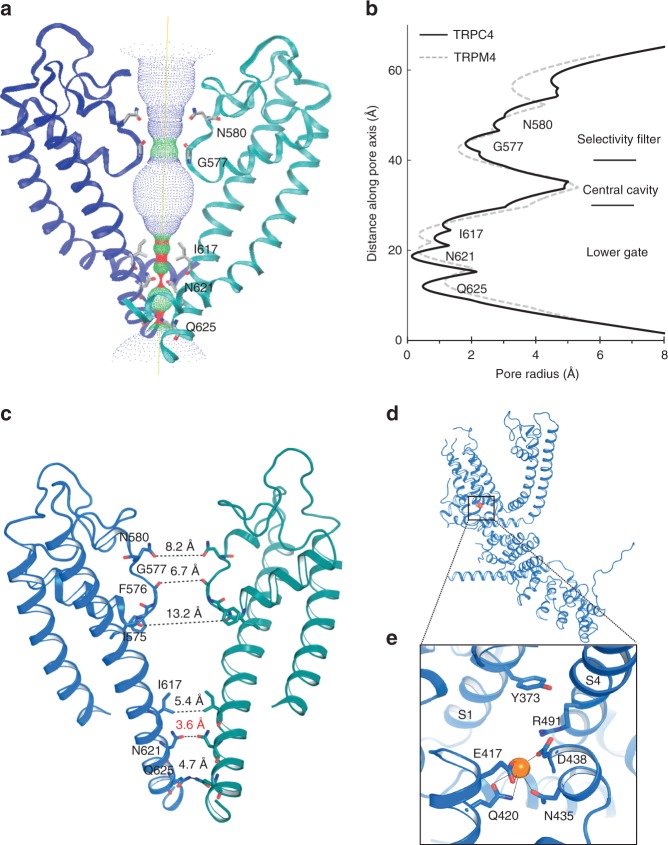
TRPC4 ion conduction pathway. a Ion conduction pathway shown as dots and mapped using HOLE. b Pore radius along the central axis. The side chains of G577 form a narrow constriction at the selectivity filter. N621 is the most restricted site of the lower gate. The dashed line represents TRPM4 for comparison. c Side view of TRPC4’s pore region with chains A and C. The distances between diagonal residues in the selectivity filter and lower gate are labeled. d A putative Na+ binding site is found on the cytosolic side in the hydrophilic pocket of the S1–S4 domain. e Enlarged view of putative Na+ (orange sphere) ion interacting with E417, Q420, N435, and D438

