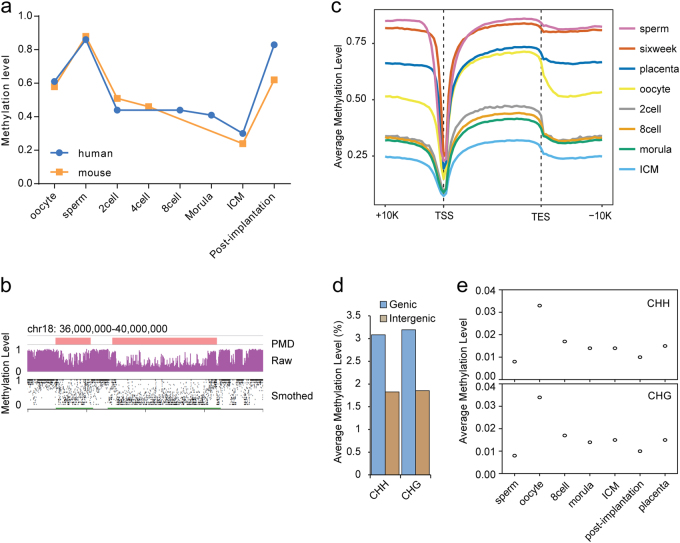
Fig. 1. Dynamics of DNA methylation during mammalian early embryogenesis.
a Average methylation level of genome-wide CpGs during mammalian early embryogenesis. The average methylation level in each stage is the mean of the methylation levels of each 500 bp tile. Only the tiles containing at least 3 CpG reads are considered. b Partially methylated domains (PMDs) in human oocytes. The upper panel is a snapshot of the genome browser for the PMDs. The lower panel is the DNA methylation smoothed by MethylseekR in the same region. Green bars indicate PMDs. c Distribution of methylation levels across all of the Refseq gene bodies, 10 kb upstream and downstream regions of transcriptional start sites (TSSs) and TESs (transcriptional end sites) for different stages. Gene bodies were divided into 40 intervals. The 10 kb upstream and downstream regions of TSSs and TSEs were divided into 25 intervals. The methylation levels of these intervals were calculated and plotted. Each tile should cover at least 5 CpG reads. d Genic and intergenic non-CpG methylation levels in human oocytes. e Dynamics of the average methylation levels of cytosines within CHG and CHH contents during early embryogenesis. The average methylation level is the mean value of the methylation levels of all non-CG cytosines. Only non-CG sites with a 5× depth were considered

