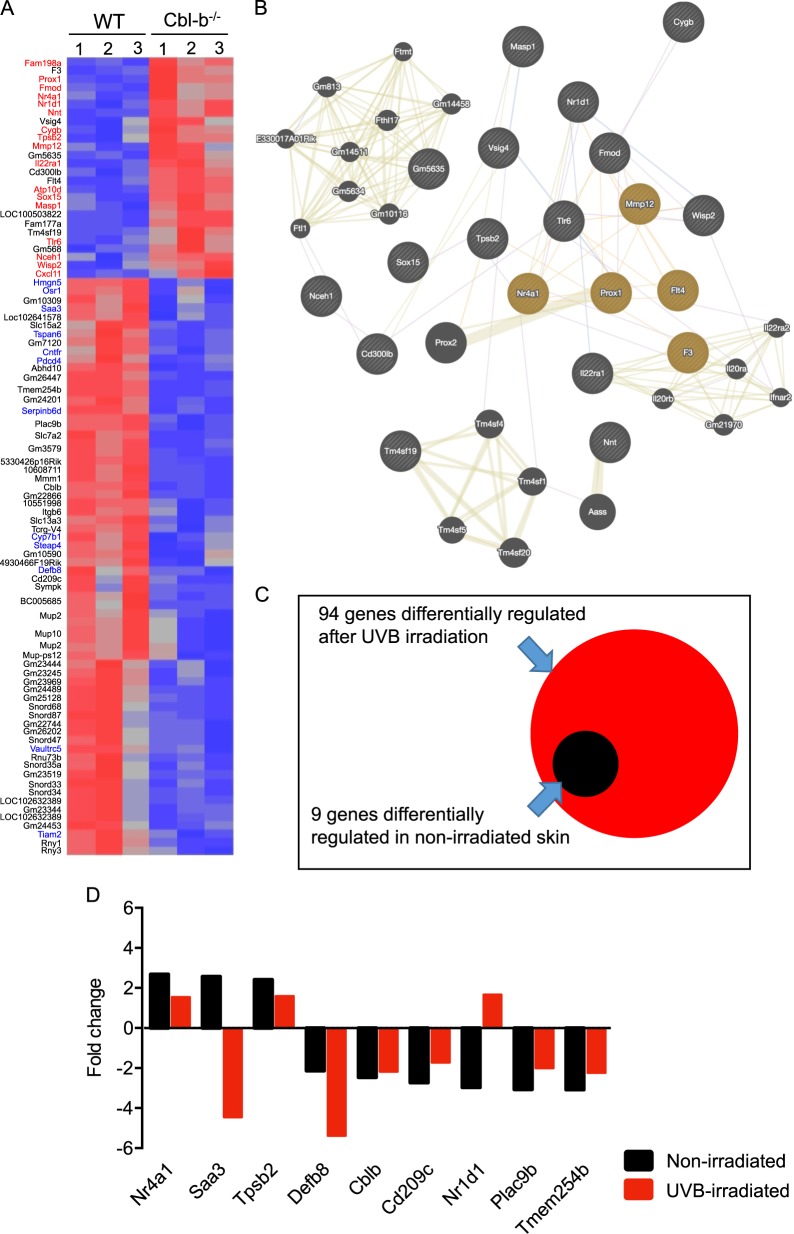
Fig. 2.
Gene expression analyzes on UVB-irradiated mice. WT and Cbl-b−/− mice were sacrificed at 24 h after a single UVB exposure. Irradiated skin was excised to isolate RNA for microarray analysis (Affymetrix Mouse Gene 1.0 ST Array) and for immunostaining. a Heat map showing differentially expressed genes in Cbl-b−/− compared to WT mice (n = 3 mice per group). Ninety-four genes were found deregulated as defined by a p value < 0.05 and ±1.5-fold change as cut off. Highest to lowest gene expression is depicted as red to blue color code in the heat map (Partek Genomics Suite 6.5). Gene names marked in red and blue are discussed in the Results section. b Gene interaction network of upregulated genes (large circles). A cluster of genes associated to positive regulation of epithelial cell proliferation was found (FDR = 0.0042, brown circles). A prediction of upregulated genes by shared domain (medium circles) or coexpression (small circles) was done with GeneMANIA webserver. Nodes are connected by co-localization (blue lines) and predicted/shared protein domains (brown lines). c Overlapping of differentially expressed genes in skin of Cbl-b−/− vs. WT mice before (black) and after UVB irradiation (red). d Fold change comparison of nine genes with preexisting differential expression in nonirradiated and UVB-irradiated mice. Fold changes in Cbl-b−/− vs. WT are shown in the waterfall plot

