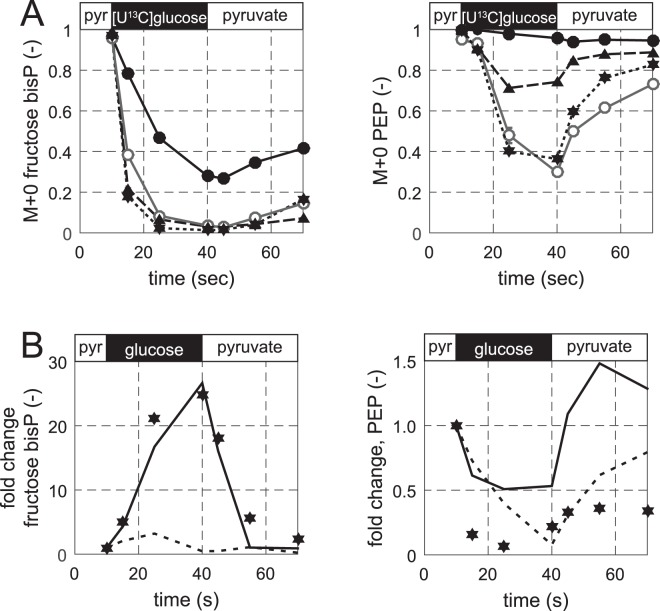
Figure 4.
Metabolite and isotope dynamics during a shift from a non-preferred to a preferred carbon source and back. [12C]pyruvate was replaced by [U-13C]glucose and the culture was shifted back to [12C]pyruvate. (A) Isotope labelling dynamics in E. coli (grey solid line with open circles), B. subtilis 168 trp + wild type (black solid line with filled circles), B. subtilis constitutive glcT (black dashed line with triangles), and B. subtilis constitutive glcT and ΔcggR (black dotted line with stars). (B) Metabolite concentration changes in the transcriptionally deregulated strain B. subtilis constitutive glcT and ΔcggR. Experimental data are denoted by filled stars. Kinetic model predictions by the best base model and the model with the allosteric interactions PEP(-)Pfk and PEP(+)Fbp are denoted by the dashed and solid lines, respectively.

