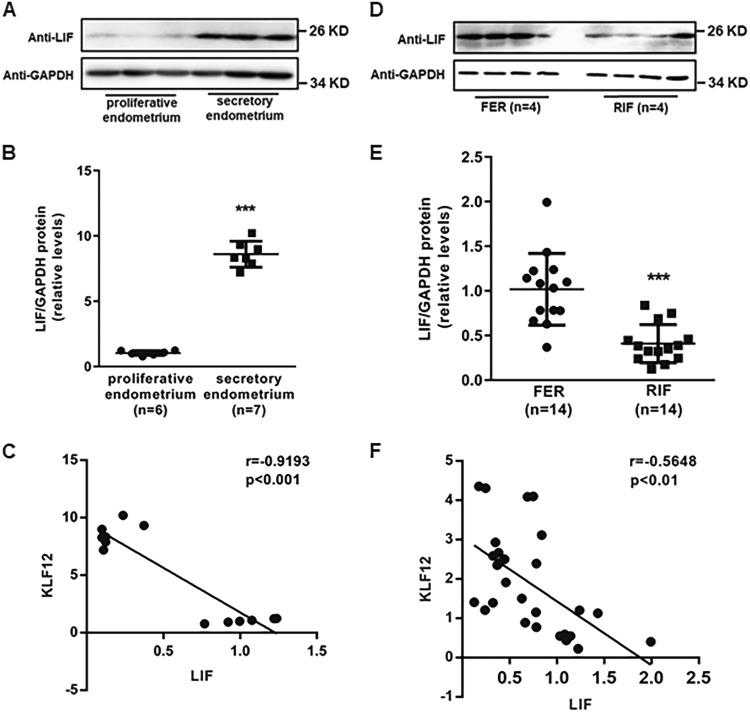
Fig. 6. Correlation of KLF12 and LIF in the endometrium.
a, b The total LIF protein levels of the FER and RIF endometria were normalized to GAPDH expression, and the data for all of the endometrial samples are shown in the scatter plots. ***P < 0.001 compared with the FER control. c Correlation between KLF12 and LIF protein expression in the proliferative- and secretory-phase endometria (n = 13, r = −0.9193, P < 0.001). d, e The total LIF protein levels of the proliferative- and secretory-phase endometrium were normalized to GAPDH expression, and the data for all of the endometrial samples are shown in the scatter plots. ***P < 0.001 compared with the proliferative endometrium. f Correlation between KLF12 and LIF protein expression in the RIF and fertile control endometria (n = 28, r = −0.5648, P < 0.01)

