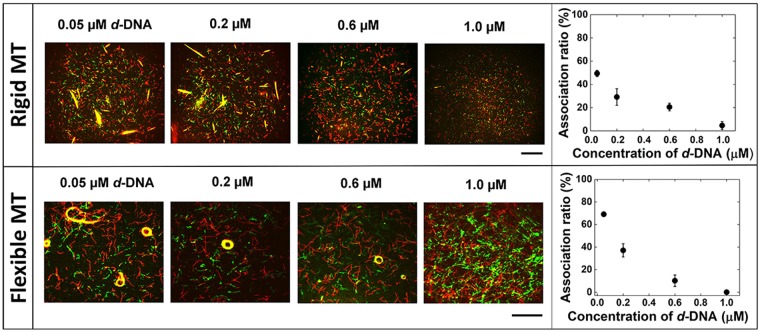
Figure 4.
Effect of the concentration of d-DNA on the dissociation of the swarms of r-DNA1 and r-DNA2 conjugated rigid MTs (GMPCPP-MTs) and flexible MTs (GTP-MTs) into single MTs. Fluorescence microscopy images showing the rigid MTs after dissociation of the swarms with translational motion in the presence of varying concentrations of d-DNA (0.05–1.0 µM); the graph shows the effect of the concentration of d-DNA on the association ratio of the MTs (Rigid MT). Fluorescence microscopy images showing the flexible MTs after dissociation of the swarms with circular motion and association ratio measured for swarming with circular motion upon varying the concentration of d-DNA (Flexible MT). The d-DNA was introduced after 60 min of ATP addition in order to allow the formation of swarms in the presence of l-DNA (0.6 μM). The images were captured and the association ratio was measured after 60 min of d-DNA addition. Scale bar: 50 µm. The concentration of the r-DNA1 and r-DNA2 conjugated MTs, i.e. the red and green MTs was 0.6 μM each. The concentration of kinesin was 0.3 μM. Error bar: s.e.m.

