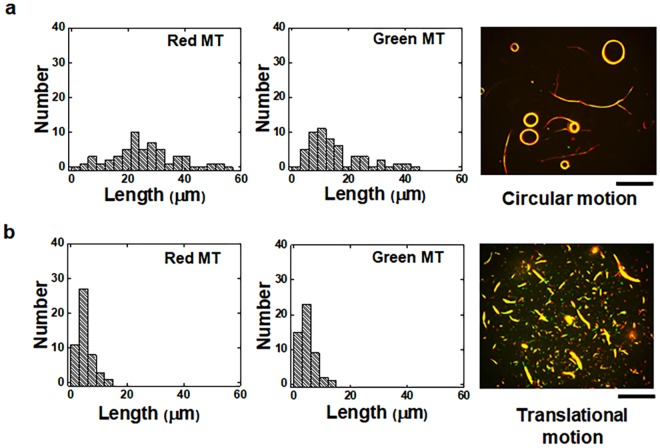
Figure 5.
Effect of the length of r-DNA1 and r-DNA2 conjugated flexible MTs on the mode of swarming of the MTs. (a) Histograms of the length of r-DNA1 conjugated MTs (red MTs) and r-DNA2 conjugated MTs (green MTs) just after their preparation. The fluorescence microscopy image shows the swarms of MTs which exhibited circular motion. The average lengths of the red and green flexible MTs were 22.2 ± 12.5 µm and 16.2 ± 9.0 µm respectively. (b) Histograms of the length of the r-DNA1 conjugated MTs (red MTs) and the r-DNA2 conjugated MTs (green MTs) after shear treatment (ten times). The fluorescence microscopy image shows the swarms of MTs which exhibited translational motion. The length of the red and green flexible MTs was 4.7 ± 2.5 µm and 4.7 ± 2.4 µm respectively. The number of MTs considered for the length measurement was 50 in each case. The images were captured after 60 min of the addition of l-DNA and ATP. The concentration of the red and green MTs was 0.6 μM each. The concentration of l-DNA was 0.6 μM. The concentration of kinesin was 0.3 μM. Scale bar: 50 µm.

