Fig. 1.
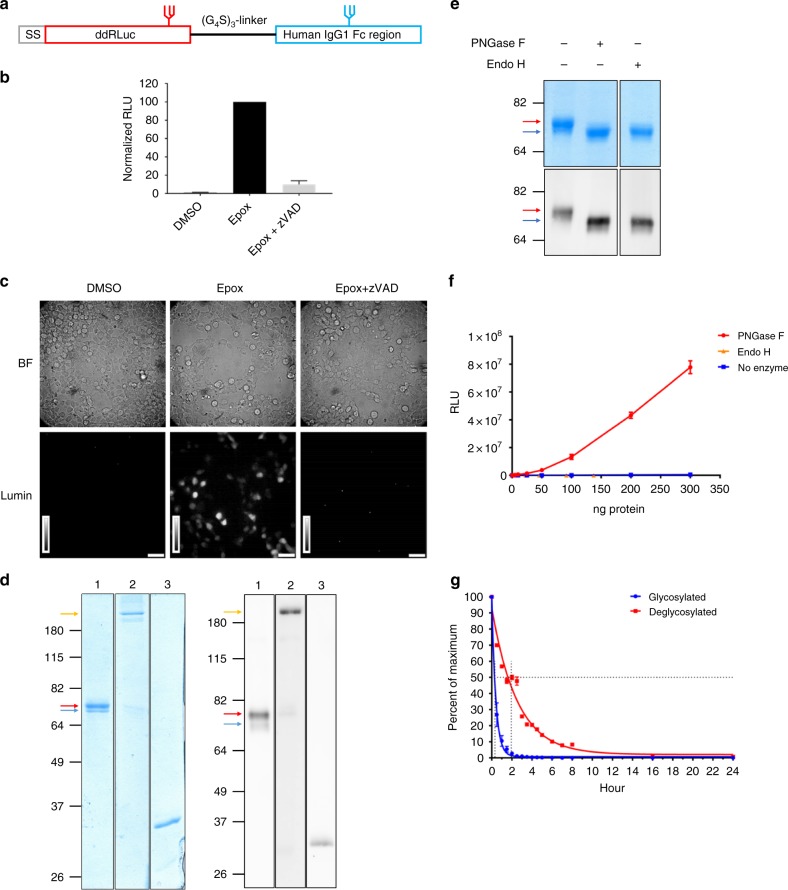
Generation and characterization of ddRLuc-Fc. a Schematic description of ddRLuc-Fc. The red glycan at N290 within ddRLuc is required for the deglycosylation-dependent activity. The blue glycan in the CH2 region of human IgG1 Fc is required for efficient binding to Fc receptor (FcR)50. b, c ddRLuc-Fc shows proteasome inhibition- and NGLY1 deglycosylation-dependent activity. ddRLuc-Fc-transfected 293T cells were incubated with DMSO alone, 200 nM Epox in DMSO, or a combination of 200 nM Epox and 20 μm zVAD in DMSO, at 37 °C for 6 h. In b equal amounts of cell lysates were tested for luciferase activity as described in Methods; activities are normalized to that seen with Epox only, which is set to 100 (bars represent the mean +/−s.d. of one representative experiment with triplicates). In c intact cells were examined by luminescence microscopy (BF: bright field; Lumin: luminescence; scale bar = 50 μm; brightness bar inserts: 0 to 255, linear scale). d Purification of recombinant ddRLuc-Fc. Coomassie Blue staining (left panel) and western blot (right panel) of purified ddRLuc-Fc. Lane 1: purified ddRLuc-Fc in reducing sample buffer; Lane 2: purified ddRLuc-Fc in non-reducing sample buffer; Lane 3: recombinant RLuc in reducing sample buffer. Red arrow indicates glycosylated ddRLuc-Fc; blue arrow indicates unglycosylated ddRLuc-Fc; yellow arrow indicates ddRLuc-Fc dimer. e, f In vitro deglycosylation by PNGase F or Endo H followed by SDS gel electrophoresis (e, upper panel: Coomassie Blue staining; lower panel: western blot) or luciferase assays (f, points represent the mean +/−s.d. of one representative experiment with triplicates). g Relative stabilities of glycosylated (blue line) and deglycosylated (red line) ddRLuc-Fc. Samples were incubated at 37 °C for various times and immediately examined by luciferase assays. The horizontal dashed line refers to 50% activity compared to initial activity, and the vertical dash line indicates the t1/2. Points represent the mean +/− s.d. of one representative experiment with triplicates. In b–g, representative data from three independent experiments are shown

