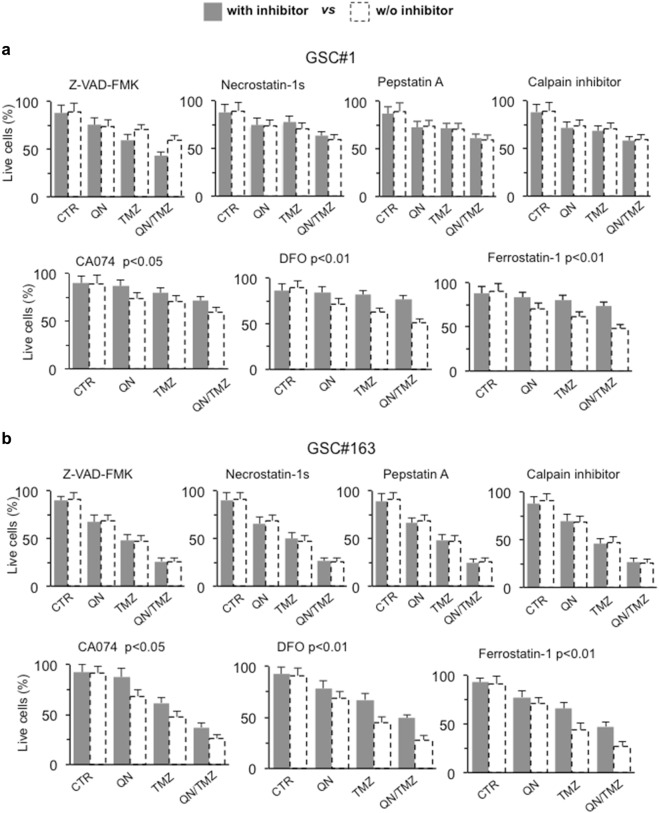
Fig. 4. In vitro characterization of cell death induced by QN/TMZ association in GSC#1 and GSC#163.
FACS analysis after staining with calcein-AM (which is retained in the cytoplasm of live cells) of a GSC#1 and b GSC#163 untreated or treated 72 h with 450 μM TMZ, 5 μM QN or their association in the presence or absence of specific inhibitors of different cell death pathways. Values in ordinate represent the percentage of calcein-positive cells. Results are the mean among three independent experiments performed in duplicate and are reported as means ± SD. Where indicated, p values are referred to cells treated with TMZ/QN (dashed columns) vs. cells underwent the same pharmacological treatments in the presence of the specified death inhibitor

