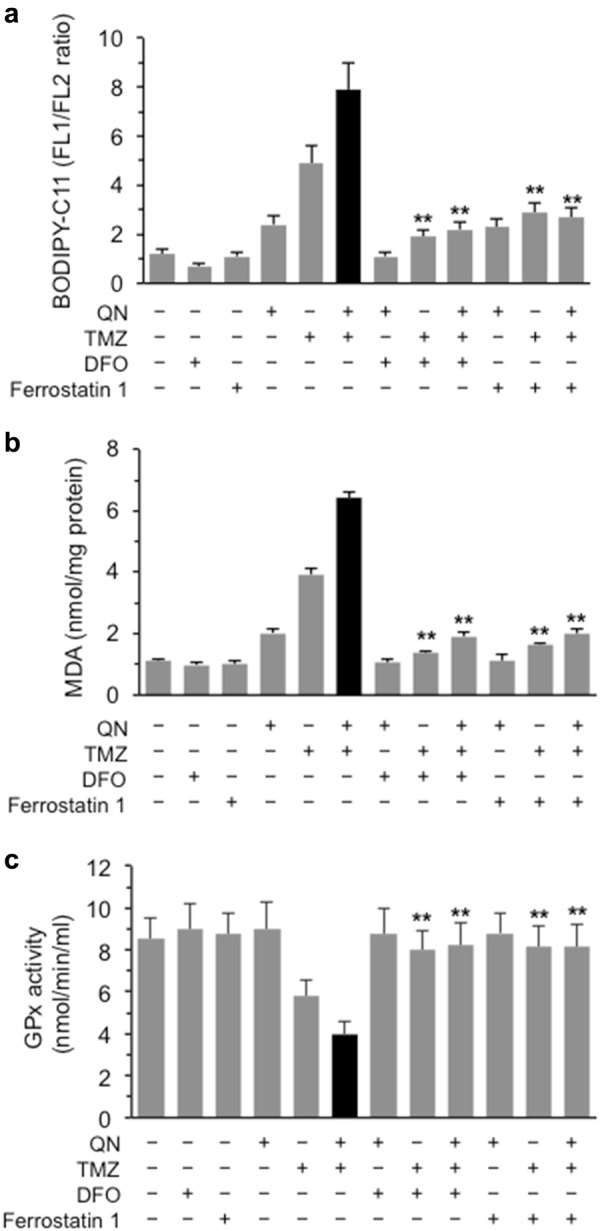
Fig. 6. In vitro evaluation of ferroptosis markers.

a Flow cytometry evaluation of lipid ROS levels by using BODIPY-C11 dye. b Colorimetric measurement of MDA production and c spectrophotometric evaluation of GPx activity in GSC#1 untreated or treated with TMZ, QN, or their association in the presence or absence of the ferroptosis inhibitors DFO or Ferrostatin 1. Results obtained from two independent experiments performed in triplicate are reported as means ± SD. (**) indicate p < 0.01 vs. TMZ/QN-treated cells
