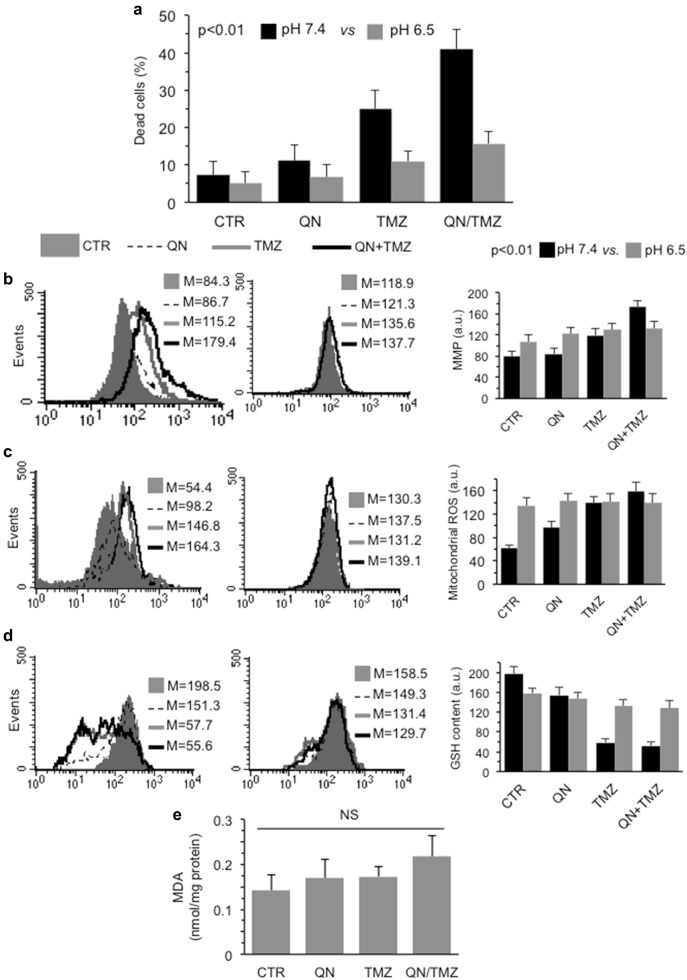
Fig. 7. Cytotoxic activity of TMZ and QN, alone or in association, in acidic medium.
FACS analysis of different cellular parameters carried out in GSC#1 treated 72 h with 450 μM TMZ, 5 μM QN or their association in neutral (pH 7.4, left panel) or acidic (pH 6.5, right panel) medium. a Cell death evaluation after staining with calcein-AM. In ordinate, the percentage of dead cells (negative to calcein-AM). b Mitochondrial membrane potential (MMP) analysis performed by using TMRM. c Mitochondrial ROS production by using MitoSOX-red. d GSH intracellular content after cell staining with MCB. In ordinate, the median fluorescence intensity. p < 0.01 TMZ/QN at pH 7.4 vs. QN/TMZ at pH 6.5. e Colorimetric measurement of MDA in GSC#1 cells untreated or treated 72 h with 450 μM TMZ, 5 μM QN or their association. Results obtained from three independent experiments performed in duplicate were reported as means ± SD

