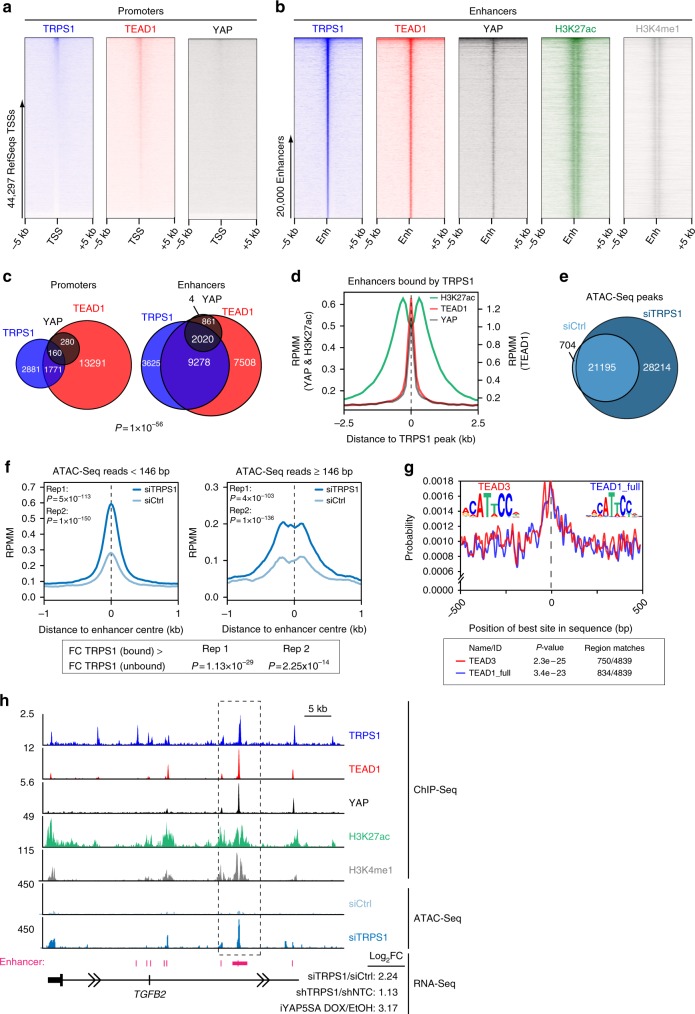
Fig. 3.
TRPS1 and YAP/TEAD bind to an overlapping set of genomic sites. a Heatmaps of ChIP-Seq data from MCF7 cells showing the occupancy of TRPS1, TEAD1 and YAP at all RefSeq transcriptional start sites (TSSs). The heatmap was sorted according to TRPS1 binding. b Heatmaps of ChIP-Seq data from MCF7 cells showing the occupancy of TRPS1, TEAD1 and YAP at all enhancer regions. The heatmap was sorted according to TRPS1 binding. The enhancer-specific chromatin marks were taken from a previously published data set45. The same contrasts for promoters (a) and enhancers (b) were used to demonstrate the differences in binding strength between the two. c Venn diagram showing the numbers of promoters and enhancers, respectively, bound by TRPS1, TEAD1 and YAP in MCF7 cells. d ChIP-Seq density profiles for H3K27ac, YAP and TEAD1 in a ±2.5-kb window surrounding the centre of TRPS1 peaks at enhancer sites. e Venn diagram for the numbers of ATAC-Seq peaks in T47D cells transfected with control siRNAs (siCtrl) or a siRNAs targeting TRPS1, respectively. f Distribution of ATAC-Seq reads with an insert size ≥146 bp (left), or with an insert size <146 bp (right) at enhancers bound by TRPS1 after TRPS1 depletion by siRNAs in T47D cells. P-values were calculated using a two-sided Wilcox-test. Rep1 replicate 1, Rep2 replicate 2. Indicated below are P-values for ATAC-Seq signals that describe if enhancers bound by TRPS1 are more strongly affected by TRPS1 depletion than enhancers not bound by TRPS1. Two-sided Wilcox-test. g Centrimo analysis for TEAD1 and TEAD3 binding motifs at TRPS1-bound enhancer sites in a 1-kb window. The reads are centred on the respective TRPS1 peak. h Sequencing tracks for ChIP-Seq data and ATAC-Seq data of the TGFB2 locus. The last row shows the Log2 fold change (Log2FC) of TGFB2 expression determined by RNA-Seq in MCF7 and T47D cells after TRPS1 depletion and in MCF7 cells after overexpression of YAP 5SA

