Fig. 4.
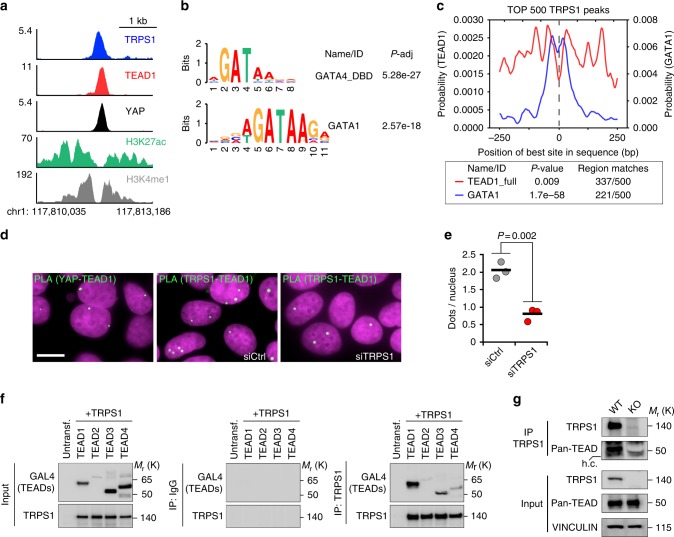
TRPS1 gets recruited to TEAD sites by cooperative binding. a ChIP-Seq tracks for TRPS1, TEAD1, YAP, H3K27ac and H3K4me1 at the VTCN1 Enhancer region. b Motif enrichment analysis (DREME) for GATA4 and GATA1 binding sites in TRPS1 ChIP peaks. c Centrimo analysis for GATA1 and TEAD1 motifs to identify enriched binding sites surrounding the Top 500 TRPS1 ChIP-Seq peaks. d Representative pictures from proximity ligation assay (PLA) experiments in MCF7 cells. The pictures show PLA signals (in green) for YAP and TEAD (positive control, left) or TEAD1 and TRPS1 after treatment with siRNAs targeting TRPS1 or control siRNAs (siCtrl). e Quantification of PLA signals for the TEAD1-TRPS1 interaction in MCF7 cells treated with siTRPS1 or siCtrl, respectively. Values are presented as the number of dots per nucleus for each of the three biological replicates. A horizontal bar indicates the average. For quantification, at least 400 cells per replicate were counted. Student’s t-test. f Co-immunoprecipitation experiment from 293T cells co-expressing TRPS1 and the indicated GAL4-tagged TEAD proteins. The lysates were subjected to immunoprecipitations using a TRPS1 antibody or IgG as a control and subsequently analyzed by Western blot. IgG controls and TRPS1 precipitates were analyzed on the same membrane. g Endogenous co-immunoprecipitation experiment from MCF7 WT and KO TRPS1. The lysates were subjected to immunoprecipitations using a TRPS1 antibody and subsequently analyzed by Western blot using a Pan-TEAD antibody; h.c. heavy chain

