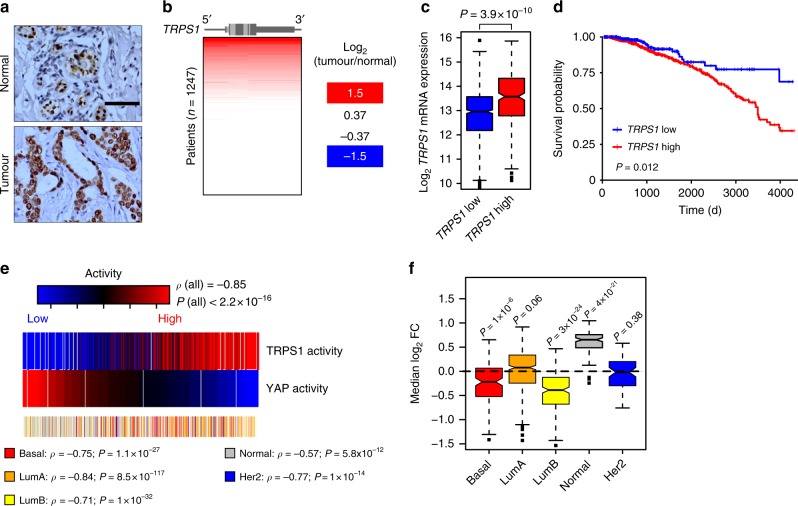
Fig. 7.
TRPS1 is overexpressed in breast cancer and is predictive for survival. a Immunohistochemical staining for TRPS1 on tissue sections from human breast cancer patients. Scale bar = 50 μm. b TRPS1 gene amplification level in tumour vs. normal breast tissue from breast cancer patients of the TCGA data set. c Box plot showing TRPS1 mRNA levels in patients stratified according to the level of amplification of the TRPS1 locus. Median: black line; boxes: data points between the first and third quartiles; whiskers: up to 1.5 × interquartile range; points: outliers. Wilcox-test, two-sided. d Kaplan–Meier plot for the survival probability of breast cancer patients that were stratified based on their TRPS1 amplification status. TRPS1 high: patients with TRPS1 amplification status above the third quartile compared to TRPS1 low (remaining patients). Chi-square test. e Analysis of TRPS1 and YAP activity in breast cancer patients (see Methods). The correlation between TRPS1 and YAP activities is given for all patients (all) and for the given breast cancer subtypes. The correlation coefficients (ρ) and the corresponding P-values were determined by a Spearman rank correlation test. f Box plots showing the expression of genes repressed by TRPS1 in different breast cancer subtypes. Median: black line; boxes: data points between the first and third quartiles; whiskers: up to 1.5 × interquartile range; points: outliers. Wilcox-test, two-sided

