
Fig. 4.
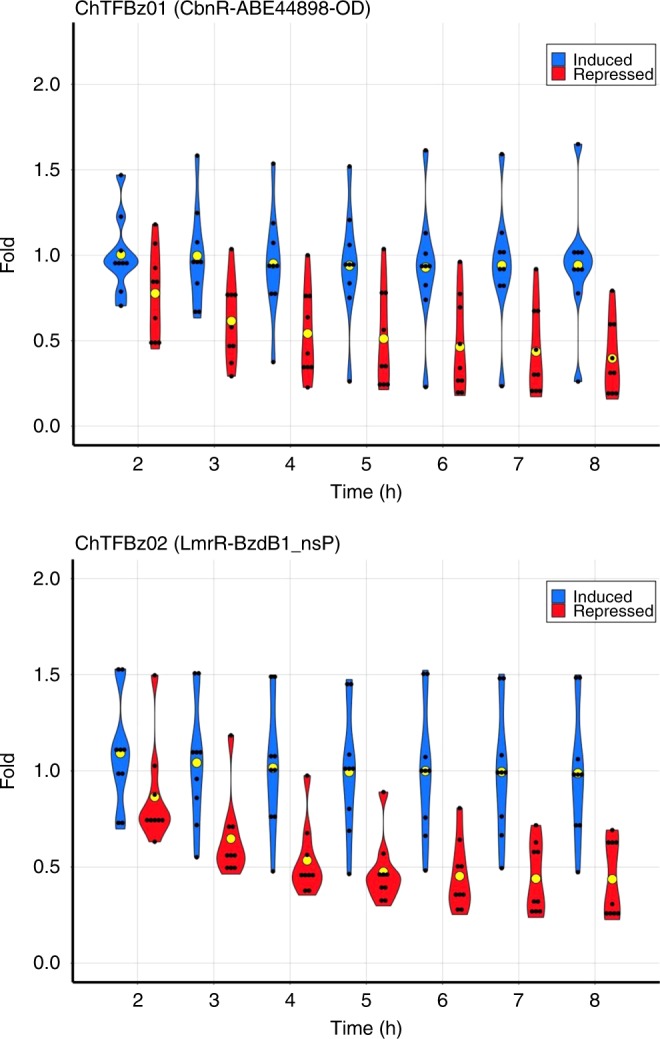
In vivo validation of ChTFBz01 (CbnR-ABE44898-OD) and ChTFBz02 (LmrR-BzdB1_nSP). Time course showing relative GFP fluorescence of AYC ChTFBz01 and AYC ChTFBz02 strains grown in minimal medium in a multiwell plate reader as indicated in Methods. Promoter activity is measured as fold of the relative fluorescence (fluorescence in arbitrary units/OD600) of the strains grown under inducing conditions (cultures supplemented with aTc and benzoate; blue violin plots) or repressing conditions (cultures supplemented with aTc; red violin plots) compared to the basal expression of the promoter (no aTc and no benzoate). The average value for every condition at a given time point corresponds to a yellow circle (n = 6–10). It can be appreciated how in order to maintain the basal activity (fold = 1) the addition of benzoate to the culture medium is necessary when the chimeras are expressed by the addition of aTc. The difference between repressed and induced expression is statistically significant from the third hour of the culture on. Growth conditions and fluorescence assays performed as described in Methods