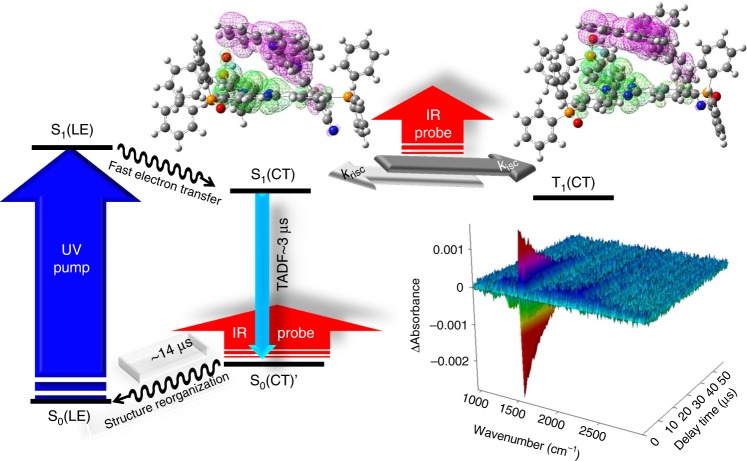
Fig. 3.
The proposed TADF cycle. There illustrate the pump (266 nm)-probe (IR) Step-Scan FTIR experiment combined with the theorical calculation structure: the optimized CN-Cz2:PO-T2T exciplex structure in its S1 and T1 state, associated with HOMO (pink) and LUMO (green). The isovalue for the contours is 0.02. Note that the distance shown in double arrow bar (red) is estimated by the distance between two center planes. See text for detailed explanation

