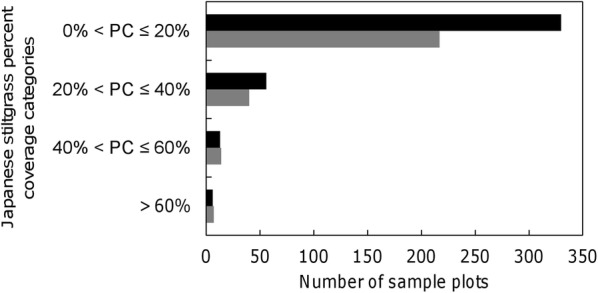
Fig. 2.

Comparison of the percent coverage (PC) of Japanese stiltgrass during the first survey (2000–2005, gray bar) and the second survey (2006–2011, black bar) conducted by the Forest Inventory and Analysis Program of the U.S. Forest Service. Results are summarized in terms of the number of plots in each of the indicated categories: 0% < PC ≤ 20%, 20% < PC ≤ 40%, 40% < PC ≤ 60%, and PC > 60%
