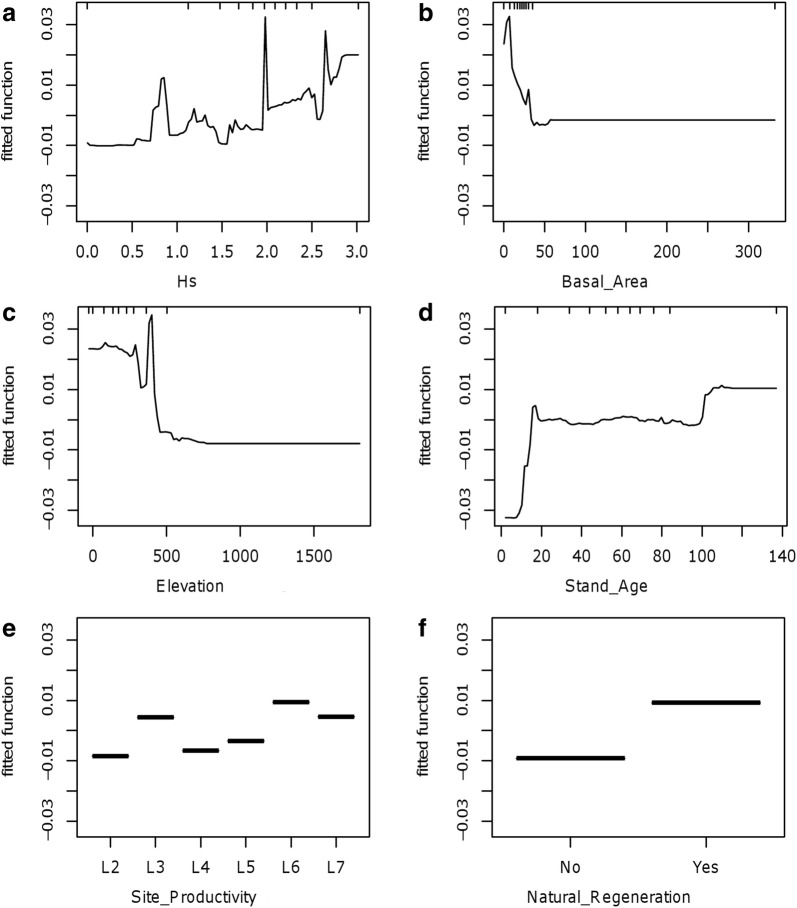
Fig. 3.
Partial dependence plots for the explanatory variables included in the optimal boosted regression tree model for Japanese stiltgrass presence based on analyses of the six most influential variables. Hash marks at the top of plot a–d indicate distribution of sample plots along the range of the indicated variable. There is no hash mark at the top of plot e and f because the partial dependence plots represent categorical variables. X-axes indicate influential variables and their relative contributions (%) in the final model (see Table 1 for the description of variables). Y-axes are based on the logit scale used for the indicated variable

