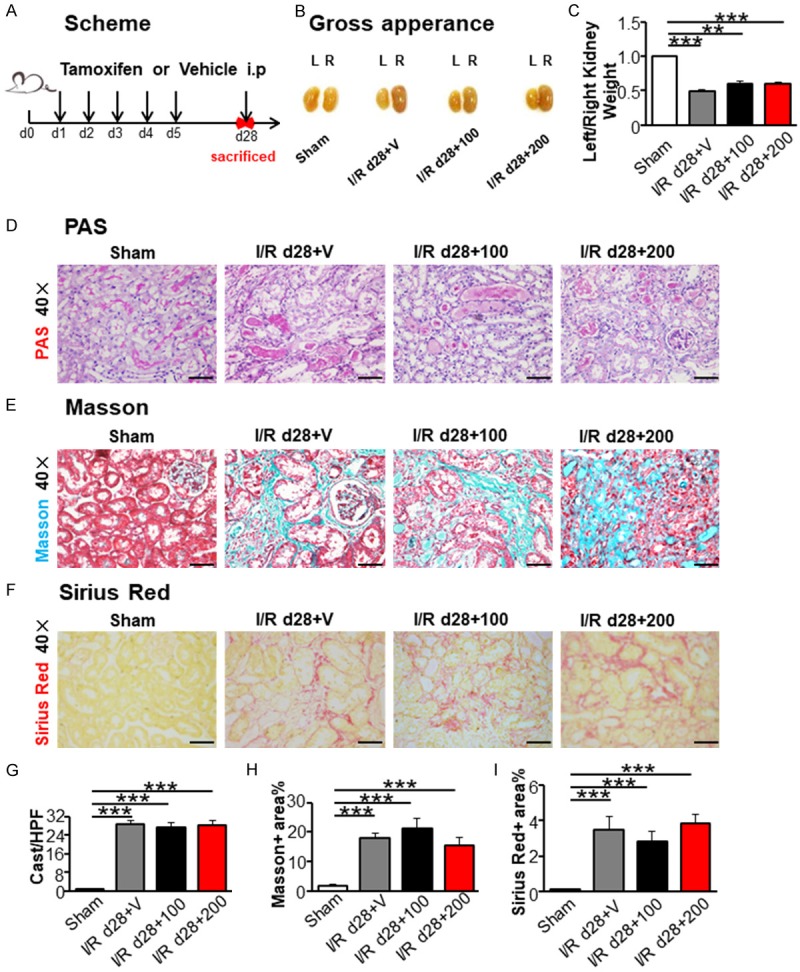
Figure 4.

Tamoxifen treatment did not ameliorate renal injury induced by I/R at day 28. (A) Scheme of the experimental plan. (B) Kidney gross appearance from mice in each group. (C) The ratio (left/right) of kidney weight. (D) PAS staining. Masson trichrome staining (E) and Sirius red staining (F) representing interstitial collagen deposition, original magnification × 400. Graph (G-I) presented quantitative data of renal cast formation, Masson positive area and Sirius red positive area. Scale bar =50 µm. Statistical differences between groups were analyzed by one-way ANOVA followed by Tukey’s post-tests. Values were mean ± SEM. (N=4/group. *P<0.05, **P<0.01, ***P<0.001).
