
Figure 5.
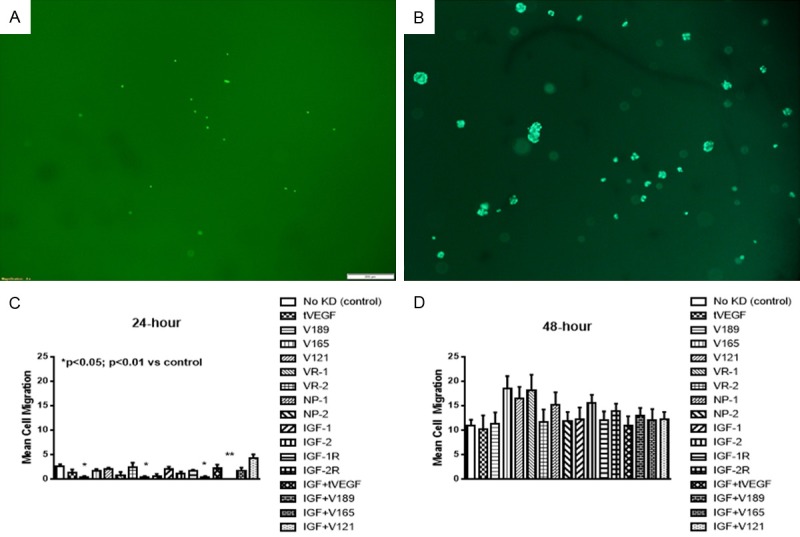
Representative sample of migration capacity of human retinal endothelial cells (HRECs) at 24 (A) and 48 (B) hours post VEGF transfection. Cells were stained with calcein AM fluorescent dye, the plates were imaged, and the number of cells that migrated to the bottom was determined at 24 (C) and 48 (D) hours. Data are expressed as mean ± SEM (n=4 samples/group; *P<0.05, **P<0.01 vs. control). Images were captured at 4× magnification.