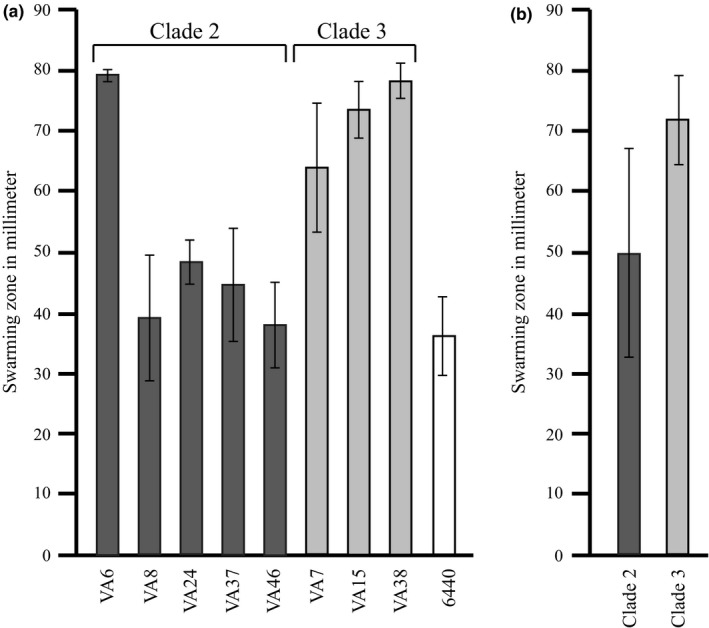
Figure 4.

Motility shown as swarming diameters in soft agar plates. (a) The motility of the C. coli water isolates (n = 8) and the C. coli clade 1 reference strain LMG 6440. Mean values of 3 experiments with error bars indicating SDs are shown. (b) The motility of the C. coli water isolates grouped together according to the clades (clade 2, n = 5; clade 3, n = 3). Mean values of isolates in each group with error bars indicating SDs are shown
