
Figure 1.
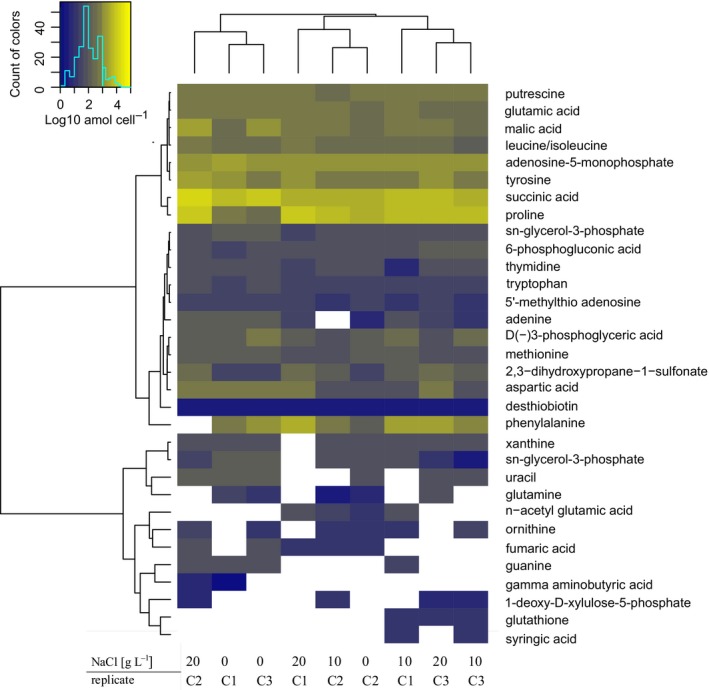
Heatmap showing the most abundant intracellular metabolites at three different sodium chloride concentrations (0, 10, and 20 g/L NaCl). C1, C2, and C3 corresponds to replicate chemostats run at each salt concentration. Concentrations of each metabolite are given as log10 attomol per cell. Metabolites only detected in one replicate are not included